
Page 896 - MARSIUM'21 COMP OF PAPER
P. 896
897 Tam & Adaviah (2022)
males and 26.8 thousand (49%) females. In this study, since the respondents were only customers of the pharmacy, purposive sampling
techniques were used to select samples from the population. Questionnaires will be distributed to the respondents by using sample-to-
variable ratio sampling (Memon et al., 2020). “The sample-to-variable ratio suggests a minimum observation-to-variable ratio of 5:1, but
ratios of 15:1 or 20:1 are preferred” (Hair et al., 2018). Based on a five-to-one ratio, the calculation of the minimum sample size is the
multiple of all variables used in this study. Calculation as below:
Independent variable : (7 dimension with total of 21 items) x 5
: 21 x 5 = 105
Dependent variable : ( 7 items x 5)
: 7 x 5 = 35
Total respondents under sample to variable ratio : 105 + 35 = 140
Minimum of 140 respondents were required to conduct this study by referring to the calculation above. After the distribution process,
the researchers managed to collect more than the minimum number of 140 respondents and archive 155 respondents. The questionnaire
was developed to be distributed in two ways, which are online and offline methods. The offline method is distributed manually to
respondents whereas the online method is to convert the questionnaire into an online survey using Google Forms and distribute the form
through social media.
3.3 RESEARCH INSTRUMENT
The use of quantitative methods (likert scale questions) was considered to be the most appropriate for this study. The questionnaire
consists of three parts, which include Part A, Part B and Part C. Part A contains 21 questions on all dimension elements. Meanwhile,
Part B was asked about consumer satisfaction. Finally, Section C includes five simple questions about respondents' information. This set
of questionnaires asked respondents to tick from given choices. Respondents were asked to rank the importance of these items on a scale
of 1 to 5 based on their satisfaction with them. (1 = Totally Satisfied, 2 = Satisfied, 3 = Neutral, 4 = Dissatisfied, and 5 = Totally
Dissatisfied.)
■ 4.0 DATA ANALYSIS
4.1 Profile of Respondents
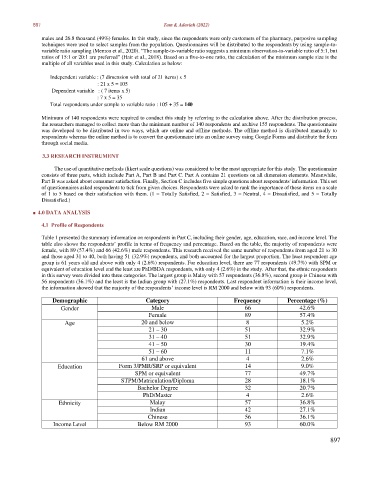
Table 1 presented the summary information on respondents in Part C, including their gender, age, education, race, and income level. The
table also shows the respondents’ profile in terms of frequency and percentage. Based on the table, the majority of respondents were
female, with 89 (57.4%) and 66 (42.6%) male respondents. This research received the same number of respondents from aged 21 to 30
and those aged 31 to 40, both having 51 (32.9%) respondents, and both accounted for the largest proportion. The least respondent age
group is 61 years old and above with only 4 (2.6%) respondents. For education level, there are 77 respondents (49.7%) with SPM or
equivalent of education level and the least are PhD/BDA respondents, with only 4 (2.6%) in the study. After that, the ethnic respondents
in this survey were divided into three categories. The largest group is Malay with 57 respondents (36.8%), second group is Chinese with
56 respondents (36.1%) and the least is the Indian group with (27.1%) respondents. Last respondent information is their income level,
the information showed that the majority of the respondents’ income level is RM 2000 and below with 93 (60%) respondents.
Demographic Category Frequency Percentage (%)
Gender Male 66 42.6%
Female 89 57.4%
Age 20 and below 8 5.2%
21 – 30 51 32.9%
31 – 40 51 32.9%
41 – 50 30 19.4%
51 – 60 11 7.1%
61 and above 4 2.6%
Education Form 3/PMR/SRP or equivalent 14 9.0%
SPM or equivalent 77 49.7%
STPM/Matriculation/Diploma 28 18.1%
Bachelor Degree 32 20.7%
PhD/Master 4 2.6%
Ethnicity Malay 57 36.8%
Indian 42 27.1%
Chinese 56 36.1%
Income Level Below RM 2000 93 60.0%
897