
Page 898 - MARSIUM'21 COMP OF PAPER
P. 898
899 Tam & Adaviah (2022)
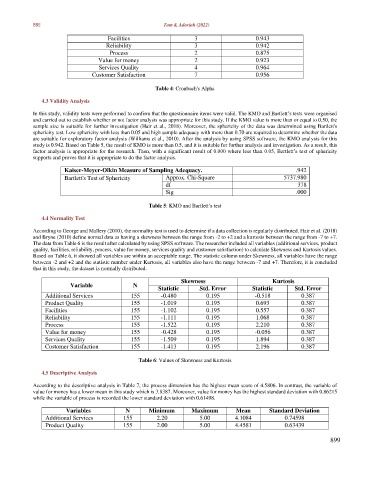
Facilities 3 0.943
Reliability 3 0.942
Process 2 0.875
Value for money 2 0.923
Services Quality 4 0.964
Customer Satisfaction 7 0.956
Table 4: Cronbach's Alpha
4.3 Validity Analysis
In this study, validity tests were performed to confirm that the questionnaire items were valid. The KMO and Bartlett’s tests were organised
and carried out to establish whether or not factor analysis was appropriate for this study. If the KMO value is more than or equal to 0.50, the
sample size is suitable for further investigation (Hair et al., 2018). Moreover, the sphericity of the data was determined using Bartlett's
sphericity test. Low sphericity with less than 0.05 and high sample adequacy with more than 0.70 are required to determine whether the data
are suitable for exploratory factor analysis (Williams et al., 2010). After the analysis by using SPSS software, the KMO analysis for this
study is 0.942. Based on Table 5, the result of KMO is more than 0.5, and it is suitable for further analysis and investigation. As a result, this
factor analysis is appropriate for the research. Then, with a significant result of 0.000 where less than 0.05, Bartlett’s test of sphericity
supports and proves that it is appropriate to do the factor analysis.
Kaiser-Meyer-Olkin Measure of Sampling Adequacy. .942
Bartlett's Test of Sphericity Approx. Chi-Square 5737.980
df 378
Sig .000
Table 5: KMO and Bartlett’s test
4.4 Normality Test
According to George and Mallery (2010), the normality test is used to determine if a data collection is regularly distributed. Hair et al. (2018)
and Bryne (2010) define normal data as having a skewness between the range from -2 to +2 and a kurtosis between the range from -7 to +7.
The data from Table 6 is the result after calculated by using SPSS software. The researcher included all variables (additional services, product
quality, facilities, reliability, process, value for money, services quality and customer satisfaction) to calculate Skewness and Kurtosis values.
Based on Table 6, it showed all variables are within an acceptable range. The statistic column under Skewness, all variables have the range
between -2 and +2 and the statistic number under Kurtosis, all variables also have the range between -7 and +7. Therefore, it is concluded
that in this study, the dataset is normally distributed.
Skewness Kurtosis
Variable N
Statistic Std. Error Statistic Std. Error
Additional Services 155 -0.480 0.195 -0.518 0.387
Product Quality 155 -1.019 0.195 0.693 0.387
Facilities 155 -1.102 0.195 0.557 0.387
Reliability 155 -1.111 0.195 1.068 0.387
Process 155 -1.522 0.195 2.210 0.387
Value for money 155 -0.428 0.195 -0.056 0.387
Services Quality 155 -1.509 0.195 1.894 0.387
Customer Satisfaction 155 -1.413 0.195 2.196 0.387
Table 6: Values of Skewness and Kurtosis
4.5 Descriptive Analysis
According to the descriptive analysis in Table 7, the process dimension has the highest mean score of 4.5806. In contrast, the variable of
value for money has a lower mean in this study which is 3.8387. Moreover, value for money has the highest standard deviation with 0.86215
while the variable of process is recorded the lower standard deviation with 0.61498.
Variables N Minimum Maximum Mean Standard Deviation
Additional Services 155 2.20 5.00 4.1084 0.74598
Product Quality 155 2.00 5.00 4.4581 0.63439
899