
Page 897 - MARSIUM'21 COMP OF PAPER
P. 897
898 Tam & Adaviah (2022)
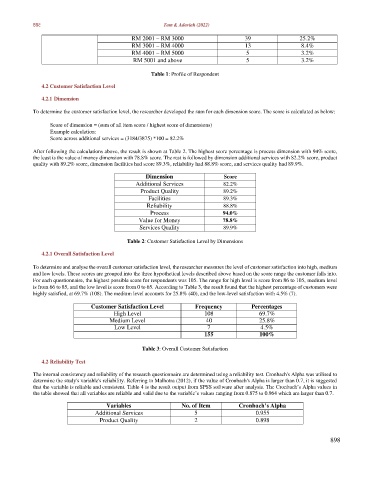
RM 2001 – RM 3000 39 25.2%
RM 3001 – RM 4000 13 8.4%
RM 4001 – RM 5000 5 3.2%
RM 5001 and above 5 3.2%
Table 1: Profile of Respondent
4.2 Customer Satisfaction Level
4.2.1 Dimension
To determine the customer satisfaction level, the researcher developed the sum for each dimension score. The score is calculated as below:
Score of dimension = (sum of all item score / highest score of dimensions)
Example calculation:
Score across additional services = (3184/3875) *100 = 82.2%
After following the calculations above, the result is shown at Table 2. The highest score percentage is process dimension with 94% score,
the least is the value of money dimension with 78.8% score. The rest is followed by dimension additional services with 82.2% score, product
quality with 89.2% score, dimension facilities had score 89.3%, reliability had 88.8% score, and services quality had 89.9%.
Dimension Score
Additional Services 82.2%
Product Quality 89.2%
Facilities 89.3%
Reliability 88.8%
Process 94.0%
Value for Money 78.8%
Services Quality 89.9%
Table 2: Customer Satisfaction Level by Dimensions
4.2.1 Overall Satisfaction Level
To determine and analyse the overall customer satisfaction level, the researcher measures the level of customer satisfaction into high, medium
and low levels. These scores are grouped into the three hypothetical levels described above based on the score range the customer falls into.
For each questionnaire, the highest possible score for respondents was 105. The range for high level is score from 86 to 105, medium level
is from 66 to 85, and the low level is score from 0 to 65. According to Table 3, the result found that the highest percentage of customers were
highly satisfied, at 69.7% (108). The medium level accounts for 25.8% (40), and the low-level satisfaction with 4.5% (7).
Customer Satisfaction Level Frequency Percentages
High Level 108 69.7%
Medium Level 40 25.8%
Low Level 7 4.5%
155 100%
Table 3: Overall Customer Satisfaction
4.2 Reliability Test
The internal consistency and reliability of the research questionnaire are determined using a reliability test. Cronbach's Alpha was utilised to
determine the study's variable's reliability. Referring to Malhotra (2012), if the value of Cronbach's Alpha is larger than 0.7, it is suggested
that the variable is reliable and consistent. Table 4 is the result output from SPSS software after analysis. The Cronbach’s Alpha values in
the table showed that all variables are reliable and valid due to the variable’s values ranging from 0.875 to 0.964 which are larger than 0.7.
Variables No. of Item Cronbach’s Alpha
Additional Services 5 0.955
Product Quality 2 0.898
898