
Page 899 - MARSIUM'21 COMP OF PAPER
P. 899
900 Tam & Adaviah (2022)
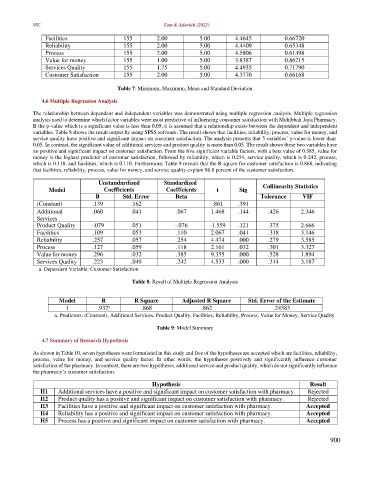
Facilities 155 2.00 5.00 4.4645 0.66720
Reliability 155 2.00 5.00 4.4409 0.65348
Process 155 2.00 5.00 4.5806 0.61498
Value for money 155 1.00 5.00 3.8387 0.86215
Services Quality 155 1.75 5.00 4.4935 0.71790
Customer Satisfaction 155 2.00 5.00 4.3770 0.66168
Table 7: Minimum, Maximum, Mean and Standard Deviation
4.6 Multiple Regression Analysis
The relationship between dependent and independent variables was demonstrated using multiple regression analysis. Multiple regression
analysis used to determine which factor variables were most predictive of influencing consumer satisfaction with Muhibbah Jaya Pharmacy.
If the p-value which is a significant value is less than 0.05, it is assumed that a relationship exists between the dependent and independent
variables. Table 8 shows the result output by using SPSS software. The result shows that facilities, reliability, process, value for money, and
service quality have positive and significant impact on customer satisfaction. The analysis presents that 5 variables’ p-value is lower than
0.05. In contrast, the significant value of additional services and product quality is more than 0.05. The result shows these two variables have
no positive and significant impact on customer satisfaction. From the five significant variable factors, with a beta value of 0.385, value for
money is the highest predictor of customer satisfaction, followed by reliability, which is 0.254, service quality, which is 0.242, process,
which is 0.118, and facilities, which is 0.110. Furthermore, Table 9 reveals that the R square for customer satisfaction is 0.868, indicating
that facilities, reliability, process, value for money, and service quality explain 86.8 percent of the customer satisfaction.
Unstandardized Standardized Collinearity Statistics
Model Coefficients Coefficients t Sig
B Std. Error Beta Tolerance VIF
(Constant) .139 .162 .861 .391
Additional .060 .041 .067 1.468 .144 .426 2.346
Services
Product Quality -.079 .051 -.076 -1.559 .121 .375 2.666
Facilities .109 .053 .110 2.067 .041 .318 3.146
Reliability .257 .057 .254 4.474 .000 .279 3.585
Process .127 .059 .118 2.161 .032 .301 3.327
Value for money .296 .032 .385 9.355 .000 .528 1.894
Services Quality .223 .049 .242 4.533 .000 .314 3.187
a. Dependent Variable: Customer Satisfaction
Table 8: Result of Multiple Regression Analysis
Model R R Square Adjusted R Square Std. Error of the Estimate
a
1 .932 .868 .862 .24583
a. Predictors: (Constant), Additional Services, Product Quality, Facilities, Reliability, Process, Value for Money, Service Quality
Table 9: Model Summary
4.7 Summary of Research Hypothesis
As shown in Table 10, seven hypotheses were formulated in this study and five of the hypotheses are accepted which are facilities, reliability,
process, value for money, and service quality factor. In other words, the hypotheses positively and significantly influence customer
satisfaction of the pharmacy. In contrast, there are two hypotheses, additional service and product quality, which do not significantly influence
the pharmacy’s customer satisfaction.
Hypothesis Result
H1 Additional services have a positive and significant impact on customer satisfaction with pharmacy. Rejected
H2 Product quality has a positive and significant impact on customer satisfaction with pharmacy. Rejected
H3 Facilities have a positive and significant impact on customer satisfaction with pharmacy. Accepted
H4 Reliability has a positive and significant impact on customer satisfaction with pharmacy. Accepted
H5 Process has a positive and significant impact on customer satisfaction with pharmacy. Accepted
900