
Page 994 - MARSIUM'21 COMP OF PAPER
P. 994
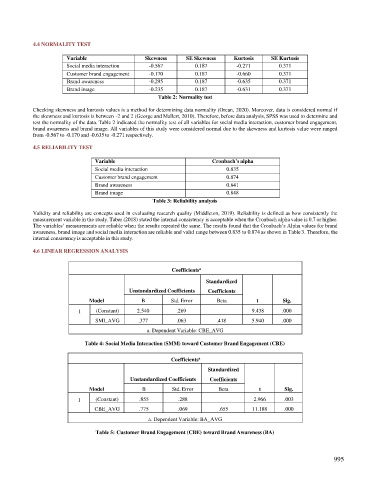
4.4 NORMALITY TEST

                       Variable                  Skewness      SE Skewness    Kurtosis     SE Kurtosis
                       Social media interaction   -0.567          0.187        -0.271        0.371
                       Customer brand engagement   -0.170         0.187        -0.660        0.371
                       Brand awareness            -0.295          0.187        -0.635        0.371
                       Brand image                -0.235          0.187        -0.631        0.371
                                                     Table 2: Normality test

            Checking skewness and kurtosis values is a method for determining data normality (Orcan, 2020). Moreover, data is considered normal if
            the skewness and kurtosis is between -2 and 2 (George and Mallert, 2010). Therefore, before data analysis, SPSS was used to determine and
            test the normality of the data. Table 2 indicated the normality test of all variables for social media interaction, customer brand engagement,
            brand awareness and brand image. All variables of this study were considered normal due to the skewness and kurtosis value were ranged
            from -0.567 to -0.170 and -0.635 to -0.271 respectively.

            4.5 RELIABILITY TEST

                                Variable                               Cronbach’s alpha
                                Social media interaction                    0.835
                                Customer brand engagement                   0.874
                                Brand awareness                             0.841
                                Brand image                                 0.848
                                                    Table 3: Reliability analysis

            Validity and reliability are concepts used in evaluating research quality (Middleton, 2019). Reliability is defined as how consistently the
            measurement variable in the study. Taber (2018) stated the internal consistency is acceptable when the Cronbach alpha value is 0.7 or higher.
            The variables’ measurements are reliable when the results repeated the same. The results found that the Cronbach’s Alpha values for brand
            awareness, brand image and social media interaction are reliable and valid range between 0.835 to 0.874 as shown in Table 3. Therefore, the
            internal consistency is acceptable in this study.

            4.6 LINEAR REGRESSION ANALYSIS


                                                                   a
                                                          Coefficients
                                                                     Standardized

                                            Unstandardized Coefficients   Coefficients
                               Model            B         Std. Error     Beta         t        Sig.

                           1     (Constant)   2.540        .269                     9.438     .000
                                 SMI_AVG       .377        .063          .418       5.940     .000
                                                  a. Dependent Variable: CBE_AVG

                             Table 4: Social Media Interaction (SMM) toward Customer Brand Engagement (CBE)

                                                          Coefficients
                                                                   a
                                                                      Standardized

                                            Unstandardized Coefficients   Coefficients
                               Model            B         Std. Error     Beta          t       Sig.

                           1     (Constant)    .855         .288                     2.966     .003
                                CBE_AVG        .775         .069         .655       11.188     .000
                                                  a. Dependent Variable: BA_AVG

                                 Table 5: Customer Brand Engagement (CBE) toward Brand Awareness (BA)


                                                                                                                995