
Page 91 - ssr_16
P. 91
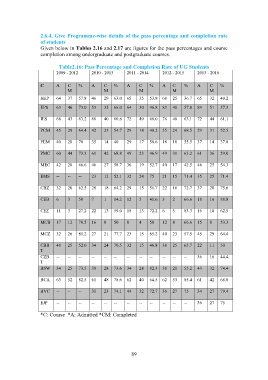
2.6.4. Give Programme-wise details of the pass percentage and completion rate
                   of students
                   Given below in Tables 2.16 and 2.17 are figures for the pass percentages and course
                   completion among undergraduate and postgraduate courses.

                           Table2.16: Pass Percentage and Completion Rate of UG Students
                          2009 - 2012     2010 - 2013    2011 - 2014     2012 - 2015     2013 - 2016


                   C      A    C    %     A    C    %    A     C   %     A    C    %     A    C    %
                               M               M               M              M               M
                   HEP    64   37   57.8  46   29  63.0  65    35   53.8  68   25   36.7  65   32   49.2

                   EPS    63   46   73.0  53   35  66.0  64    30   46.8  83   48   57.8  89   51   57.3

                   IES    68   43   63.2  66   40  60.6  72    49   68.0  76   48   63.1  72   44   61.1

                   PCM    45   29   64.4  42   23  54.7  29    14   48.2  35   24   68.5  59   31   52.5

                   PEM    40   28   70    35   14  40    29    17   58.6  18   10   55.5  37   14   37.8


                   PMC    60   44   73.3  61   42  68.8  49    23   46.9  49   31   63.2  61   36   59.0

                   MEC    42   28   66.6  46   27  58.7  36    19   52.7  40   17   42.5  46   25   54.3

                   EMS    --   --   --    23   12  52.1  32    24   75   21   15   71.4  35   25   71.4

                   CBZ    32   20   62.5  28   18  64.2  29    15   51.7  22   16   72.7  37   28   75.6

                   CEB    6    3    50    7    1    14.2  12   5   41.6  3    2    66.6  18   16   88.8


                   CEZ    11   3    27.2  22   13  59.0  18    13   72.2  6   5    83.3  16   10   62.5

                   MCB    17   12   70.5  16   8    50   8     4   50    12   8    66.6  15   8    53.3

                   MCZ    32   26   81.2  27   21  77.7  23    15   65.2  40   23   57.5  45   29   64.4

                   CBB    48   25   52.0  34   24  70.5  32    15   46.8  38   25   65.7  22   11   50
                   T
                   CZB    --   --   --    --   --   --   --    --   --   --   --   --    36   16   44.4
                   T
                   BSW    34   25   73.5  38   28  73.6  34    28   82.3  38   21   55.2  43   32   74.4


                   BCA    63   52   82.5  61   48  78.6  62    40   64.5  62   53   85.4  61   42   68.8

                   BVC    --   --   --    31   23  74.1  44    32   72.7  36   27   75   34   27   79.4

                   EJP    --   --   --    --   --   --   --    --   --   --   --   --    36   27   75

                   *C: Course  *A: Admitted *CM: Completed


                                                           89