
Page 72 - Health, Population and Environment Education 9
P. 72
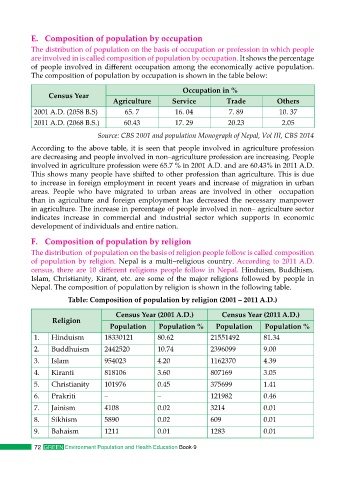
E.  Composition of population by occupation
          The distribution of population on the basis of occupation or profession in which people
          are involved in is called composition of population by occupation. It shows the percentage
          of people involved in different occupation among the economically active population.
          The composition of population by occupation is shown in the table below:

                                                      Occupation in %
               Census Year
                                  Agriculture      Service         Trade          Others
           2001 A.D. (2058 B.S)      65. 7          16. 04          7. 89         10. 37
           2011 A.D. (2068 B.S.)     60.43          17. 29         20.23           2.05

                             Source: CBS 2001 and population Monograph of Nepal, Vol III, CBS 2014
          According to the above table, it is seen that people involved in agriculture profession
          are decreasing and people involved in non–agriculture profession are increasing. People
          involved in agriculture profession were 65.7 % in 2001 A.D. and are 60.43% in 2011 A.D.
          This shows many people have shifted to other profession than agriculture. This is due
          to increase in foreign employment in recent years and increase of migration in urban
          areas. People who have migrated to urban areas are involved in other  occupation
          than in agriculture and foreign employment has decreased  the necessary  manpower
          in agriculture. The increase in percentage of people involved in non– agriculture sector
          indicates increase in commercial and industrial sector which supports in economic
          development of individuals and entire nation.

          F.  Composition of population by religion
          The distribution  of population on the basis of religion people follow is called composition
          of population by religion. Nepal is a multi–religious country. According to 2011 A.D.
          census, there are 10 different religions people follow in Nepal. Hinduism, Buddhism,
          Islam, Christianity, Kirant, etc. are some of the major religions followed by people in
          Nepal. The composition of population by religion is shown in the following table.

                     Table: Composition of population by religion (2001 – 2011 A.D.)
                                   Census Year (2001 A.D.)       Census Year (2011 A.D.)
                Religion
                                 Population    Population %     Population    Population %
           1.   Hinduism       18330121        80.62          21551492        81.34
           2.   Buddhuism      2442520         10.74          2396099         9.00
           3.   Islam          954023          4.20           1162370         4.39

           4.   Kiranti        818106          3.60           807169          3.05
           5.   Christianity   101976          0.45           375699          1.41
           6.   Prakriti       –               –              121982          0.46
           7.   Jainism        4108            0.02           3214            0.01
           8.   Sikhism        5890            0.02           609             0.01
           9.   Bahaism        1211            0.01           1283            0.01

           72  GREEN Environment Population and Health Education Book-9