
Page 77 - Health, Population and Environment Education 9
P. 77
In the above table, population density of urban areas was 985 per sq. km in 2001 A.D. and
increased to 1380 per sq. km in 2011 A.D. Population density of rural areas was 138 per
sq. km in 2001 A.D. and reached 158 per sq. km in 2011 A.D. The increase in population
density of both urban and rural areas shows that there is overall increase of population in
Nepal. However, there is huge difference in population density in urban areas and rural
areas.
Activity: 1
Make a list of people of 10 houses in your locality on the basis of their caste, language,
sex, age, religion, occupation and educational status. Prepare a report and submit to
your subject teacher.
4.4 Population Distribution
The arrangement of population with respect to geographical regions, administrative
division like mountain, hills, terai, town, village, district, zone, etc. is called as population
distribution. It indicates how many people and where are they distributed in a place. The
data on population distribution supports the government, organization and individuals
to develop plan and policies based on their location and resources available.
There is difference in land topography, climate, cultivable land, soil structure, availability
of natural resources and facilities in different parts of Nepal. Hence the population
distribution is not same in all the places. Population distribution is more in urban areas
and terai region whereas less in mountain region and rural areas.
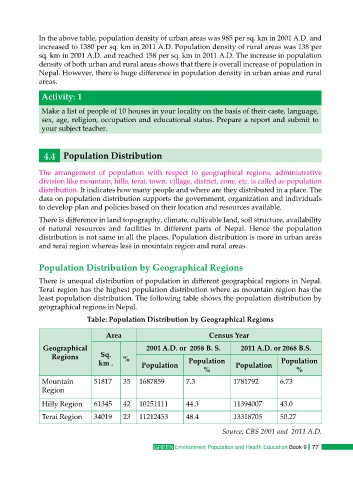
Population Distribution by Geographical Regions
There is unequal distribution of population in different geographical regions in Nepal.
Terai region has the highest population distribution where as mountain region has the
least population distribution. The following table shows the population distribution by
geographical regions in Nepal.
Table: Population Distribution by Geographical Regions
Area Census Year
Geographical 2001 A.D. or 2058 B. S. 2011 A.D. or 2068 B.S.
Regions Sq. %
km . Population Population Population Population
% %
Mountain 51817 35 1687859 7.3 1781792 6.73
Region
Hilly Region 61345 42 10251111 44.3 11394007 43.0
Terai Region 34019 23 11212453 48.4 13318705 50.27
Source: CBS 2001 and 2011 A.D.
GREEN Environment Population and Health Education Book-9 77