
Page 68 - Health, Population and Environment Education 9
P. 68
a. Economically inactive population/Dependent population
The population who cannot work and has to depend on others for their living is called
dependent population. As they don’t work, they are also called as economically inactive
population. The population below 15 years and old people of 60 years and above are
regarded as dependent population. They are not important for social and economic
development of a nation. According to 2011 A.D. census, there were 34.91% children
below 15 years of age and 8.13% of old people of 60 years and above in Nepal.
b. Economically active population/Independent population
The population who can work and do not have to depend on others for their living is called
as independent population. As they can work, they are also called as economically active
population. The population of (15 – 59) years is regarded as independent population.
They are very important for social and economic development of a nation. According to
2011 A.D. census, there was 56.96% independent population in Nepal.
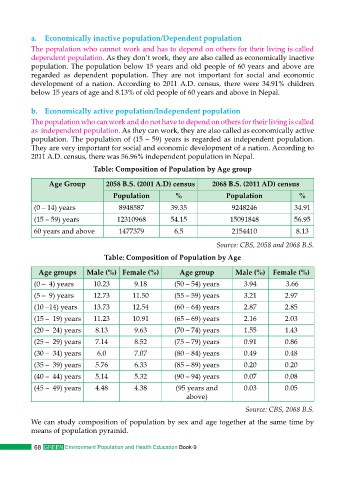
Table: Composition of Population by Age group
Age Group 2058 B.S. (2001 A.D) census 2068 B.S. (2011 AD) census
Population % Population %
(0 – 14) years 8948587 39.35 9248246 34.91
(15 – 59) years 12310968 54.15 15091848 56.95
60 years and above 1477379 6.5 2154410 8.13
Source: CBS, 2058 and 2068 B.S.
Table: Composition of Population by Age
Age groups Male (%) Female (%) Age group Male (%) Female (%)
(0 – 4) years 10.23 9.18 (50 – 54) years 3.94 3.66
(5 – 9) years 12.73 11.50 (55 – 59) years 3.21 2.97
(10 –14) years 13.73 12.54 (60 – 64) years 2.87 2.85
(15 – 19) years 11.23 10.91 (65 – 69) years 2.16 2.03
(20 – 24) years 8.13 9.63 (70 – 74) years 1.55 1.43
(25 – 29) years 7.14 8.52 (75 – 79) years 0.91 0.86
(30 – 34) years 6.0 7.07 (80 – 84) years 0.49 0.48
(35 – 39) years 5.76 6.33 (85 – 89) years 0.20 0.20
(40 – 44) years 5.14 5.32 (90 – 94) years 0.07 0.08
(45 – 49) years 4.48 4.38 (95 years and 0.03 0.05
above)
Source: CBS, 2068 B.S.
We can study composition of population by sex and age together at the same time by
means of population pyramid.
68 GREEN Environment Population and Health Education Book-9