
Page 53 - 9 teachers social book 9 @ 2077 ctp_Neat
P. 53
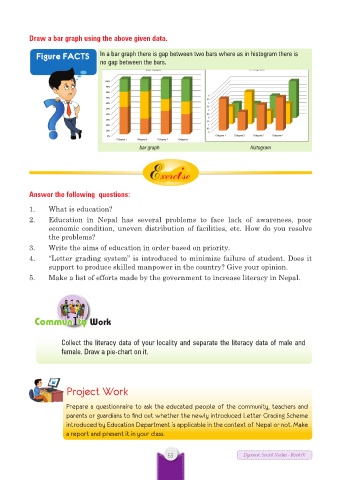
Draw a bar graph using the above given data.

            Figure FACTS      In a bar graph there is gap between two bars where as in histogram there is
                              no gap between the bars.
                                           Bar Graph                     Histograph

                                100%
                                90%
                                80%
                                                              5
                                70%
                                                             4.5
                                60%                           4
                                                             3.5
                                50%
                                                              3
                                40%                          2.5
                                                              2
                                30%
                                                             1.5
                                20%                           1
                                                             0.5
                                10%
                                                              0
                                0%                              Category 1  Category 2  Category 3  Category 4
                                   Category 1  Category 2  Category 3  Category 4

                                          bar graph                       histogram
                                            Exercise
          Answer the following  questions:
          1.   What is education?
          2.   Education in  Nepal has several problems to face lack  of awareness,  poor
               economic condition, uneven distribution of facilities, etc. How do you resolve
               the problems?
          3.   Write the aims of education in order based on priority.
          4.   “Letter grading system” is introduced to minimize failure of student. Does it
               support to produce skilled manpower in the country? Give your opinion.
          5.   Make a list of efforts made by the government to increase literacy in Nepal.


           Community Work


                   Collect the literacy data of your locality and separate the literacy data of male and
                   female. Draw a pie-chart on it.


                    Project Work

                    Prepare a questionnaire to ask the educated people of the community, teachers and
                    parents or guardians to find out whether the newly introduced Letter Grading Scheme
                    introduced by Education Department is applicable in the context of Nepal or not. Make
                    a report and present it in your class.


                                                  53                    Dynamic Social Studies - Book IX