
Page 11 - ANUAL REPORT MOH 2017
P. 11
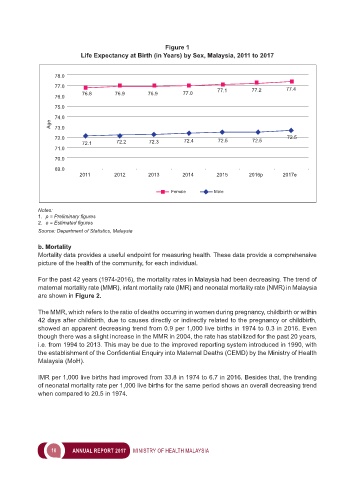
Figure 1
                           Life Expectancy at Birth (in Years) by Sex, Malaysia, 2011 to 2017


                   78.0
                   77.0                                                          77.2       77.4
                           76.8       76.9      76.9       77.0       77.1
                   76.0
                   75.0
                   74.0
                 Age  73.0

                   72.0                                     72.4       72.5       72.5       72.5
                           72.1       72.2       72.3
                   71.0
                   70.0
                   69.0
                          2011        2012      2013       2014       2015       2016p     2017e


                                                        Female       Male

             Notes:
             1.  p = Preliminary figures
             2.  e = Estimated figures
             Source: Department of Statistics, Malaysia

             b. Mortality
             Mortality data provides a useful endpoint for measuring health. These data provide a comprehensive
             picture of the health of the community, for each individual.

             For the past 42 years (1974-2016), the mortality rates in Malaysia had been decreasing. The trend of
             maternal mortality rate (MMR), infant mortality rate (IMR) and neonatal mortality rate (NMR) in Malaysia
             are shown in Figure 2.

             The MMR, which refers to the ratio of deaths occurring in women during pregnancy, childbirth or within
             42 days after childbirth, due to causes directly or indirectly related to the pregnancy or childbirth,
             showed an apparent decreasing trend from 0.9 per 1,000 live births in 1974 to 0.3 in 2016. Even
             though there was a slight increase in the MMR in 2004, the rate has stabilized for the past 20 years,
             i.e. from 1994 to 2013. This may be due to the improved reporting system introduced in 1990, with
             the establishment of the Confidential Enquiry into Maternal Deaths (CEMD) by the Ministry of Health
             Malaysia (MoH).

             IMR per 1,000 live births had improved from 33.8 in 1974 to 6.7 in 2016. Besides that, the trending
             of neonatal mortality rate per 1,000 live births for the same period shows an overall decreasing trend
             when compared to 20.5 in 1974.


                 10     ANNUAL REPORT 2017     MINISTRY OF HEALTH MALAYSIA