
Page 9 - ANUAL REPORT MOH 2017
P. 9
INTRODUCTION
Malaysia is a vibrant and dynamic country enjoying continued economic growth and political stability
since its independence 60 years ago. Malaysians today are generally healthier, live longer, and are
better disposed to be more productive. The overall level of health attained is one of the key measures
of the success of our country. Good health enables Malaysians to lead productive and fulfilling lives. In
addition, a high level of health contributes to increased prosperity and overall social stability.
POPULATION STRUCTURE
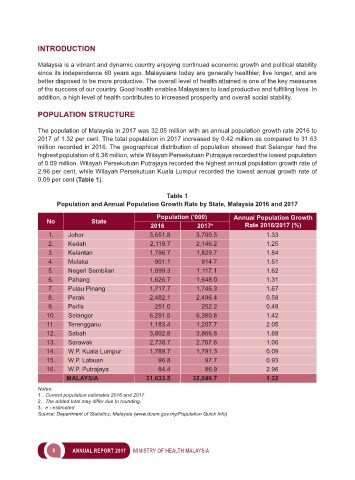
The population of Malaysia in 2017 was 32.05 million with an annual population growth rate 2016 to
2017 of 1.32 per cent. The total population in 2017 increased by 0.42 million as compared to 31.63
million recorded in 2016. The geographical distribution of population showed that Selangor had the
highest population of 6.38 million, while Wilayah Persekutuan Putrajaya recorded the lowest population
of 0.09 million. Wilayah Persekutuan Putrajaya recorded the highest annual population growth rate of
2.96 per cent, while Wilayah Persekutuan Kuala Lumpur recorded the lowest annual growth rate of
0.09 per cent (Table 1).
Table 1
Population and Annual Population Growth Rate by State, Malaysia 2016 and 2017
Population (‘000) Annual Population Growth
No State
2016 2017 e Rate 2016/2017 (%)
1. Johor 3,651.8 3,700.5 1.33
2. Kedah 2,119.7 2,146.2 1.25
3. Kelantan 1,796.7 1,829.7 1.84
4. Melaka 901.1 914.7 1.51
5. Negeri Sembilan 1,099.3 1,117.1 1.62
6. Pahang 1,626.7 1,648.0 1.31
7. Pulau Pinang 1,717.7 1,746.3 1.67
8. Perak 2,482.1 2,496.4 0.58
9. Perlis 251.0 252.2 0.48
10. Selangor 6,291.5 6,380.8 1.42
11. Terengganu 1,183.4 1,207.7 2.05
12. Sabah 3,802.8 3,866.8 1.68
13. Sarawak 2,738.7 2,767.6 1.06
14. W.P. Kuala Lumpur 1,789.7 1,791.3 0.09
15. W.P. Labuan 96.8 97.7 0.93
16. W.P. Putrajaya 84.4 86.9 2.96
MALAYSIA 31,633.5 32,049.7 1.32
Notes:
1. Current population estimates 2016 and 2017
2. The added total may differ due to rounding.
3. e - estimated
Source: Department of Statistics, Malaysia (www.dosm.gov.my/Population Quick Info)
8 ANNUAL REPORT 2017 MINISTRY OF HEALTH MALAYSIA