
Page 12 - ANUAL REPORT MOH 2017
P. 12
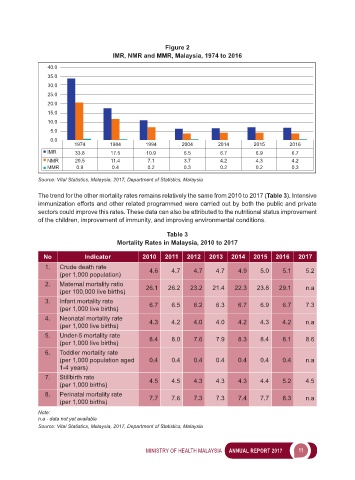
Figure 2
                                     IMR, NMR and MMR, Malaysia, 1974 to 2016

                40.0
                35.0
                30.0
                25.0
                20.0
                15.0
                10.0
                 5.0
                 0.0
                         1974       1984        1994       2004        2014       2015        2016
                IMR      33.8       17.5        10.9        6.5        6.7         6.9        6.7
                NMR      20.5       11.4        7.1         3.7        4.2         4.3        4.2
                MMR      0.9         0.4        0.2         0.3        0.2         0.2        0.3
             Source: Vital Statistics, Malaysia, 2017, Department of Statistics, Malaysia

             The trend for the other mortality rates remains relatively the same from 2010 to 2017 (Table 3). Intensive
             immunization efforts and other related programmed were carried out by both the public and private
             sectors could improve this rates. These data can also be attributed to the nutritional status improvement
             of the children, improvement of immunity, and improving environmental conditions.

                                                      Table 3
                                      Mortality Rates in Malaysia, 2010 to 2017
               No           Indicator          2010   2011   2012   2013   2014   2015   2016   2017
               1.   Crude death rate             4.6    4.7    4.7    4.7    4.9    5.0    5.1     5.2
                    (per 1,000 population)
               2.   Maternal mortality ratio    26.1   26.2   23.2   21.4   22.3   23.8   29.1     n.a
                    (per 100,000 live births)
               3.   Infant mortality rate        6.7    6.5    6.2    6.3    6.7    6.9    6.7     7.3
                    (per 1,000 live births)
               4.   Neonatal mortality rate      4.3    4.2    4.0    4.0    4.2    4.3    4.2     n.a
                    (per 1,000 live births)
               5.   Under-5 mortality rate       8.4    8.0    7.6    7.9    8.3    8.4    8.1     8.6
                    (per 1,000 live births)
               6.   Toddler mortality rate
                    (per 1,000 population aged   0.4    0.4    0.4    0.4    0.4    0.4    0.4     n.a
                    1-4 years)
               7.   Stillbirth rate              4.5    4.5    4.3    4.3    4.3    4.4    5.2     4.5
                    (per 1,000 births)
               8.   Perinatal mortality rate                                7.7  7.6  7.3  7.3  7.4  7.7  8.3  n.a
                    (per 1,000 births)

             Note:
             n.a - data not yet available
             Source: Vital Statistics, Malaysia, 2017, Department of Statistics, Malaysia


                                                MINISTRY OF HEALTH MALAYSIA     ANNUAL REPORT 2017       11