Page 72 - Class-11-Physics-Part-1_Neat
P. 72

58                                                                                     PHYSICS

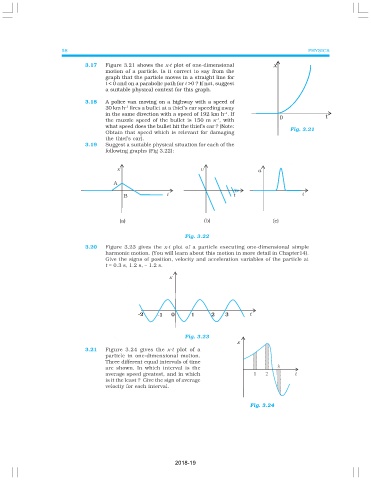
                               3.17   Figure 3.21 shows the x-t plot of one-dimensional
                                      motion of a particle. Is it correct to say from the
                                      graph that the particle moves in a straight line for
                                      t < 0 and on a parabolic path for t >0 ? If not, suggest
                                      a suitable physical context for this graph.

                               3.18   A police van moving on a highway with a speed of
                                             –1
                                      30 km h  fires a bullet at a thief’s car speeding away
                                                                                –1
                                      in the same direction with a speed of 192 km h . If
                                                                              –1
                                      the muzzle speed of the bullet is 150 m s , with
                                      what speed does the bullet hit the thief’s car ? (Note:              Fig. 3.21
                                      Obtain that speed which is relevant for damaging
                                      the thief’s car).
                               3.19   Suggest a suitable physical situation for each of the
                                      following graphs (Fig 3.22):


                                                                   Fig. 3.22
                               3.20   Figure 3.23 gives the x-t  plot of a particle executing one-dimensional simple
                                      harmonic motion. (You will learn about this motion in more detail in Chapter14).
                                      Give the signs of position, velocity and acceleration variables of the particle at
                                      t = 0.3 s, 1.2 s, – 1.2 s.


                                                                   Fig. 3.23

                               3.21   Figure 3.24 gives the x-t  plot of a
                                      particle in one-dimensional motion.
                                      Three different equal intervals of time
                                      are shown. In which interval is the
                                      average speed greatest, and in which
                                      is it the least ?  Give the sign of average
                                      velocity for each interval.


                                                                                          Fig. 3.24


                                                               2018-19
   67   68   69   70   71   72   73   74   75   76   77