
Page 74 - Class-11-Physics-Part-1_Neat
P. 74
60 PHYSICS
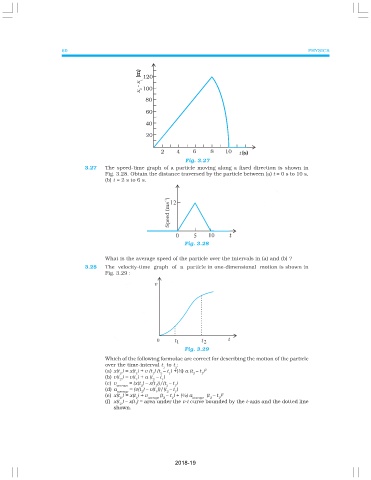
Fig. 3.27
3.27 The speed-time graph of a particle moving along a fixed direction is shown in
Fig. 3.28. Obtain the distance traversed by the particle between (a) t = 0 s to 10 s,
(b) t = 2 s to 6 s.
Fig. 3.28
What is the average speed of the particle over the intervals in (a) and (b) ?
3.28 The velocity-time graph of a particle in one-dimensional motion is shown in
Fig. 3.29 :
Fig. 3.29
Which of the following formulae are correct for describing the motion of the particle
over the time-interval t to t :
1 2
(a) x(t ) = x(t ) + v (t ) (t – t ) +(½) a (t – t ) 2
2 1 1 2 1 2 1
(b) v(t ) = v(t ) + a (t – t )
2 1 2 1
(c) v = (x(t ) – x(t ))/(t – t )
average 2 1 2 1
(d) a = (v(t ) – v(t ))/(t – t )
average 2 1 2 1
(e) x(t ) = x(t ) + v (t – t ) + (½) a (t – t ) 2
2 1 average 2 1 average 2 1
(f) x(t ) – x(t ) = area under the v-t curve bounded by the t-axis and the dotted line
2 1
shown.
2018-19