Page 118 - The Atlas of Economic Complexity
P. 118

MAPPING PATHS TO PROSPERITY  |  119


                   POPULATION ≥ 9.7 M / (73/12)  GDP ≥ USD 17 b / (99/18)  EXPORTS PER CAPITA ≥ USD 714 / (87/17)  *   Data are from 2008. Numbers indicate:
                                                                                                          value (World Ranking / Regional Ranking).
                   TOTAL EXPORTS ≥ USD 6.9 b / (88/12)  GDPpc ≥ USD 1,720 / (96/20)  EXPORTS AS SHARE OF GDP ≥ 42 % (42/4)    Latin America and the Caribbean.

                    ELECTRONICS  MACHINERY  AIRCRAFT   bOILERS   SHIPS   METAL PRODUCTS  CONSTR. MATL. & EqPT.  HOME & OFFICE  PULP & PAPER  CHEMICALS & HEALTH  AGROCHEMICALS  OTHER CHEMICALS  INOR. SALTS & ACIDS  PETROCHEMICALS  LEATHER  MILK & CHEESE  ANIMAL FIbERS  MEAT & EGGS  FISH & SEAFOOD  TROPICAL AGRIC.  CEREALS & vEG. OILS  COTTON/RICE/SOY & OTHERS  TObACCO  FRUIT  MISC. AGRICULTURE  NOT CLASSIFIED  TEXTILE & FAbRICS  GARMENTS  FOOD PROCESSING  bEER/SPIRITS & CIGS.  PRECIOUS STONES  COAL  OIL  MINING


                        EXPORT                                                      EXPORT
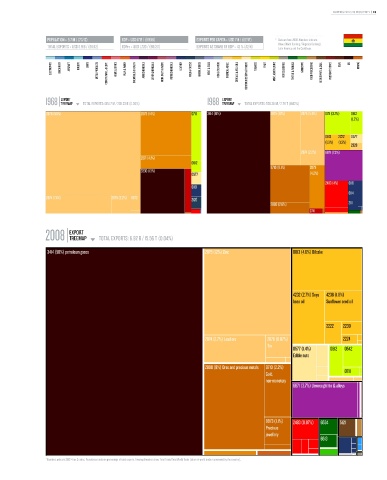
                  1968 TREEMAP  TOTAL EXPORTS: 135.17 M / 228.33 b (0.06%)    1988 TREEMAP  TOTAL EXPORTS: 578.38 M / 2.79 T (0.02%)
                                        Total Exports: 135.17 M / 228.33 B (0.06%)                   Total Exports: 578.38 M / 2.79 T (0.02%)
                  2876 (50%)                         2879 (14%)         0711  3414 (41%)              2875 (10%)  2876 (5.8%)  0711 (3.7%)  0612
                                                                                                                                    (1.7%)


                                                                                                                          0813  2222  0577
                                                                                                                          (1.3%)  (1.3%)
                                                                                                                                    2320
                                                                                                                 2874 (2.2%)  6871 (7.3%)
                                                     2871 (4.1%)
                                                                        0612
                                                                                                      9710 (9.1%)   2879
                                                     3330 (13%)
                                                                        0577                                        (4.2%)
                                                                                                                          2483 (4%)  6116
                                                                        6118
                                                                                                                                   6114
                  2874 (7.4%)             2875 (2.2%) 6872
                                                                        2120
                                                                                                      2890 (2.6%)                  2111
                                                                                                                    2741


                           EXPORT
                  2008 TREEMAP        TOTAL EXPORTS: 6.92 b / 15.56 T (0.04%)
                                                                 Total Exports: 6.92 B / 15.56 T (0.04%)
                   3414 (50%) petroleum gases                                2875 (12%) Zinc                  0813 (4.6%) Oilcake


                                                                                                              4232 (2.7%) Soya  4236 (1.8%)
                                                                                                              bean oil    Sunflower seed oil


                                                                                                                          2222   2239

                                                                             2874 (2.7%) Lead ore   2876 (0.87%)                 2224
                                                                                                    Tin
                                                                                                              0577 (1.4%)   0612  0542
                                                                                                              Edible nuts

                                                                             2890 (8%) Ores and precious metals  9710 (2.2%)
                                                                                                    Gold,                        0711
                                                                                                    non-monetary
                                                                                                              6871 (3.7%) Unwrought tin & alloys


                                                                                                    8973 (1.1%)  2483 (0.87%)  6534  5121
                                                                                                    Precious
                                                                                                    jewellery
                                                                                                                        6513


                  * Numbers indicate SITC-4 rev 2 codes. Parenthesis indicate percentage of total exports. Treemap Headers show: Total Trade/Total World Trade (share of world trade represented by the country).
   113   114   115   116   117   118   119   120   121   122   123