
Page 160 - The Atlas of Economic Complexity
P. 160
MAPPING PATHS TO PROSPERITY | 161
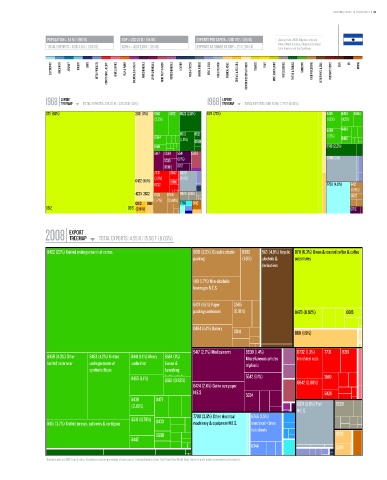
POPULATION ≥ 6.1 M / (89/15) GDP ≥ USD 22 b / (94/16) EXPORTS PER CAPITA ≥ USD 742 / (85/16) * Data are from 2008. Numbers indicate:
value (World Ranking / Regional Ranking).
TOTAL EXPORTS ≥ USD 4.6 b / (101/18) GDPpc ≥ USD 3,604 / (81/16) EXPORTS AS SHARE OF GDP ≥ 21 % (97/14) Latin America and the Caribbean.
ELECTRONICS MACHINERY AIRCRAFT bOILERS SHIPS METAL PRODUCTS CONSTR. MATL. & EqPT. HOME & OFFICE PULP & PAPER CHEMICALS & HEALTH AGROCHEMICALS OTHER CHEMICALS INOR. SALTS & ACIDS PETROCHEMICALS LEATHER MILK & CHEESE ANIMAL FIbERS MEAT & EGGS FISH & SEAFOOD TROPICAL AGRIC. CEREALS & vEG. OILS COTTON/RICE/SOY & OTHERS TObACCO FRUIT MISC. AGRICULTURE NOT CLASSIFIED TEXTILE & FAbRICS GARMENTS FOOD PROCESSING bEER/SPIRITS & CIGS. PRECIOUS STONES COAL OIL MINING
EXPORT EXPORT
1968 TREEMAP TOTAL EXPORTS: 225.20 M / 228.33 b (0.1%) 1988 TREEMAP TOTAL EXPORTS: 588.74 M / 2.79 T (0.02%)
Total Exports: 225.20 M / 228.33 B (0.1%) Total Exports: 588.74 M / 2.79 T (0.02%)
0711 (53%) 2631 (8%) 8510 8472 6522 (2.8%) 0711 (72%) 8435 8433 6584
(2.2%) (1.6%) (1.2%)
8439 8434
6513 6521
6584 (1.5%) 8465
(1.8%)
6549
6581 6513 (2.2%)
5417 5530 5541 5629
5335 (1.1%) 0360 (5%)
0819 0712
7731 6842 0360
(1.2%) (2.1%)
0422 (1.5%) 6996
6732 7788 (4.8%) 6421
(0.9%)
4233 2632 6421 0914 8928 6951 0579
(1.7%) (0.88%)
0813 0611 7782 6612
0612 0615 (0.91%) 0712
EXPORT
2008 TREEMAP TOTAL EXPORTS: 4.55 b / 15.56 T (0.03%)
Total Exports: 4.55 B / 15.56 T (0.03%)
8462 (23%) Knitted undergarments of cotton 8931 (2.2%) Closable plastic 0980 5121 (4.8%) Acyclic 0711 (6.3%) Green & roasted coffee & coffee
packing (1.6%) alcohols & substitutes
derivatives
1110 (1.7%) Non-alcoholic
beverages N.E.S.
6421 (1.5%) Paper 0585
packing containers (0.81%) 0470 (0.92%) 0615
0484 (1.4%) Bakery
0914 0611 (1.9%)
5417 (2.7%) Medicaments 8939 (1.4%) 6732 (1.3%) 7731 8219
8459 (4.3%) Other 8463 (4.2%) Knitted 8441 (1.1%) Men's 6584 (1%) Miscellaneous articles Iron/steel rods
knitted outerwear undergarments of undershirt Linens & of plastic
synthetic fibers furnishing
8465 (1.1%) textile articles 5542 (1.1%) 3510
6552 (0.83%)
6424 (2.4%) Cut to size paper 6842 (0.88%)
N.E.S. 5334 6428
8439 8471
(0.76%) 0371 (2.6%) Fish 8928
N.E.S.
7788 (3.6%) Other electrical 6746 (1.5%)
8510 (0.76%) 8433
8451 (3.7%) Knitted jerseys, pullovers & cardigans machinery & equipment N.E.S. Iron/steel <3mm
tick sheets
2690 2882
8442
6744 2789
* Numbers indicate SITC-4 rev 2 codes. Parenthesis indicate percentage of total exports. Treemap Headers show: Total Trade/Total World Trade (share of world trade represented by the country).