
Page 162 - The Atlas of Economic Complexity
P. 162
MAPPING PATHS TO PROSPERITY | 163
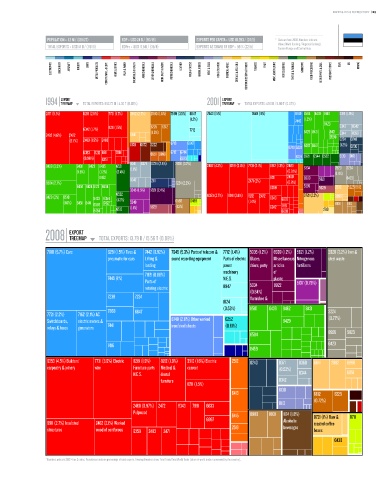
POPULATION ≥ 1.3 M / (125/27) GDP ≥ USD 24 b / (90/19) EXPORTS PER CAPITA ≥ USD 10,293 / (24/5) * Data are from 2008. Numbers indicate:
value (World Ranking / Regional Ranking).
TOTAL EXPORTS ≥ USD 14 b / (74/16) GDPpc ≥ USD 17,541 / (35/4) EXPORTS AS SHARE OF GDP ≥ 59 % (22/5) Eastern Europe and Central Asia.
ELECTRONICS MACHINERY AIRCRAFT bOILERS SHIPS METAL PRODUCTS CONSTR. MATL. & EqPT. HOME & OFFICE PULP & PAPER CHEMICALS & HEALTH AGROCHEMICALS OTHER CHEMICALS INOR. SALTS & ACIDS PETROCHEMICALS LEATHER MILK & CHEESE ANIMAL FIbERS MEAT & EGGS FISH & SEAFOOD TROPICAL AGRIC. CEREALS & vEG. OILS COTTON/RICE/SOY & OTHERS TObACCO FRUIT MISC. AGRICULTURE NOT CLASSIFIED TEXTILE & FAbRICS GARMENTS FOOD PROCESSING bEER/SPIRITS & CIGS. PRECIOUS STONES COAL OIL MINING
EXPORT EXPORT
1994 TREEMAP TOTAL EXPORTS: 852.72 M / 4.30 T (0.02%) 2001 TREEMAP TOTAL EXPORTS: 4.50 b / 5.90 T (0.07%)
Total Exports: 852.72 M / 4.30 T (0.02%) Total Exports: 4.05 B / 5.90 T (0.07%)
2471 (5.1%) 8219 (2.5%) 7731 (1.7%) 2882 (2.7%) 2890 (1.6%) 7599 (3.5%) 8947 7643 (15%) 7649 (11%) 8749 6584 8439 8510 0371 (1.9%)
(1.2%) 7449 (1.2%) 8423
6342 (1.7%) 8211 (1.5%) 5225 6612 7712 8429 8431 8421 0343 0342
2482 (4.6%) 2472 6841 (1.3%) 6589 0344 0350
(2.7%) 2460 (1.5%) 2483 0224 0240
6831 6672 3222 6716 6647 8462 8441 (1.2%)
6749 5224 0230
6353 8212 6911 7861 6861 6899 6712 6744
(0.96%) 6351 6863 6724 6521 6544 6522 6130 0113
0341 0371 0224 (2.4%) 2820 (3.2%)
8439 (3.3%) 8431 8423 8435 6521 (1.1%) 2482 (4.3%) 8219 (3.4%) 7731 (2.1%) 6912 (1.3%) 2483 5334 2820 3224
(1.5%) (1.2%) (2.4%) (0.81%) (1.4%)
8462 0342 8211 2460 8939 5621 6423
6584 (2.7%) 2111 3224 (2.2%) 2471 (2%) (0.8%)
8459 8424 6123 8434 6359 5335 5629 2882 5225 6612
3345 (1.5%) 5621 (2.4%)
6522 6353 (2.7%) 6911 (2.6%) 0721 (2.2%)
8429 (2%) 8510 8433 6354 (1.3%) 8212 2472 6343 6997 6998
(1.6%) 8451 8441 6589 8452 5249 5629 0586 0488 (1.4%) 7861 8931 1110
(1.2%)
8484 6513 (1.1%) 6342 6633 2631
EXPORT
2008 TREEMAP TOTAL EXPORTS: 13.79 b / 15.56 T (0.09%)
Total Exports: 13.79 B / 15.56 T (0.09%)
7810 (5.7%) Cars 6251 (1.5%) Tires & 7442 (0.92%) 7649 (5.3%) Parts of telecom & 7712 (1.4%) 5335 (1.2%) 8939 (1.2%) 5621 (1.2%) 2820 (3.2%) Iron &
pneumatic for cars Lifting & sound recording equipment Parts of electric Glazes, Miscellaneous Nitrogenous steel waste
loading power driers, putty articles fertilizers
machinery machinery of
7449 (1%) 7169 (0.88%) N.E.S. plastic
Parts of 5137 (0.79%)
rotating electric 8947 5334 8922
(0.84%)
7239 7234 plants N.E.S. Varnishes &
8124 lacquers
(0.53%) 8510 8439 8462 8431
7868 6647 3224
7721 (2.2%) 7162 (2.1%) AC
Switchboards, electric motors & 6749 (2.8%) Other worked 6252 8429 (0.77%)
relays & fuses generators 7441 iron/steel sheets (0.61%)
6584 8928 5825
7416 6423
8459
6353 (4.5%) Builders` 7731 (3.6%) Electric 8219 (1.9%) 8212 (1.8%) 3510 (1.6%) Electric 2512 0240 0371 0360 6841 2882 6998
carpentry & joinery wire Furniture parts Medical & current (0.52%)
N.E.S. dental 0344 6851
furniture 0342
8211 (1.5%)
6130
6413 6612 5225
0113 (0.72%)
2460 (0.97%) 2472 6343 7861 6633
Pulpwood 6415 0980 8931 1124 (1.8%)
6997 Alcoholic 0721 (1%) Raw & 0711
6911 (2.7%) Iron/steel 2482 (2.1%) Worked roasted coffee
structures wood of coniferous 6359 2483 2471 2519 beverages beans
0430
* Numbers indicate SITC-4 rev 2 codes. Parenthesis indicate percentage of total exports. Treemap Headers show: Total Trade/Total World Trade (share of world trade represented by the country).