
Page 20 - The Atlas of Economic Complexity
P. 20
MAPPING PATHS TO PROSPERITY | 21
FIGURE 2.1:
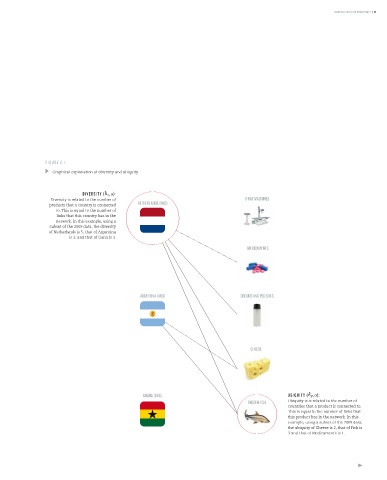
Graphical explanation of diversity and ubiquity.
DIvERSITY
Diversity (k ): :
c,0
Diversity is related to the number of
Diversity is related to the number of NETHERLANDS (NLD) X-RAY MACHINES
products that a country is connected
products that a country is connected to.
to. This is equal to the number of
links that this country has in the
This is equal to the number of links that
network. In this example, using a
this country has in the network. In this
subset of the 2009 data, the diversity
example, using a subset of the 2009 data,
of Netherlands is 5, that of Argentina
is 3, and that of Gana is 1.
the diversity of Netherlands is 5, that of
Argentina is 3, and that of Gana is 1. MEDICAMENTS
ARGENTINA (ARG) CREAMS AND POLISHES
CHEESE
Ubiquity (k ):
p,0
:
UbIqUITY
GHANA (GHA) Ubiquity is is related to the number of
countries that a product is connected to.
FROZEN FISH Ubiquity is is related to the number of
countries that a product is connected to.
This is equal to the number of links that
This is equal to the number of links that
this product has in the network. In this
this product has in the network. In this
example, using a subset of the 2009 data,
example, using a subset of the 2009 data,
the ubiquity of Cheese is 2, that of Fish is
the ubiquity of Cheese is 2, that of Fish is 3
3 and that of Medicaments is 1.
and that of Medicaments is 1.