
Page 24 - The Atlas of Economic Complexity
P. 24
MAPPING PATHS TO PROSPERITY | 25
I n f o r m at I o n B o x 2 . 2 : t h e w o r l d ’ s m o s t a n d l e a s t c o m p l e x p r o d u c t s
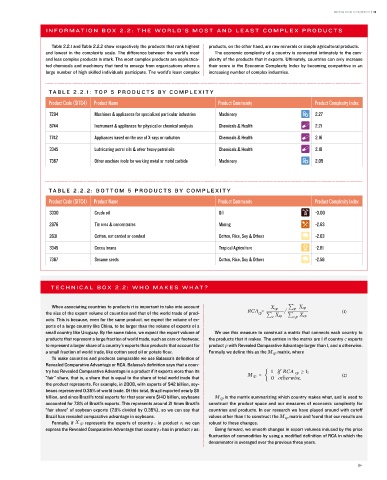
table 2.2.1 and table 2.2.2 show respectively the products that rank highest products, on the other hand, are raw minerals or simple agricultural products.
and lowest in the complexity scale. the difference between the world’s most the economic complexity of a country is connected intimately to the com-
and less complex products is stark. the most complex products are sophistica- plexity of the products that it exports. Ultimately, countries can only increase
ted chemicals and machinery that tend to emerge from organizations where a their score in the economic Complexity index by becoming competitive in an
large number of high skilled individuals participate. the world’s least complex increasing number of complex industries.
TA B L E 2 . 2 . 1 : T O P 5 P R O D U C T S B Y C O M P L E X I T Y
Product Code (SITC4) Product Name Product Community Product Complexity Index
7284 Machines & appliances for specialized particular industries Machinery 2.27
8744 Instrument & appliances for physical or chemical analysis Chemicals & Health 2.21
7742 Appliances based on the use of X-rays or radiation Chemicals & Health 2.16
3345 Lubricating petrol oils & other heavy petrol oils Chemicals & Health 2.10
7367 Other machine tools for working metal or metal carbide Machinery 2.05
TA B L E 2 . 2 . 2 : B O T T O M 5 P R O D U C T S B Y C O M P L E X I T Y
Product Code (SITC4) Product Name Product Community Product Complexity Index
3330 Crude oil Oil -3.00
2876 Tin ores & concentrates Mining -2.63
2631 Cotton, not carded or combed Cotton, Rice, Soy & Others -2.63
3345 Cocoa beans Tropical Agriculture -2.61
7367 Sesame seeds Cotton, Rice, Soy & Others -2.58
t e c h n I c a l B o x 2 . 2 : w h o m a k e s w h at ?
When associating countries to products it is important to take into account
the size of the export volume of countries and that of the world trade of prod-
ucts. this is because, even for the same product, we expect the volume of ex-
ports of a large country like China, to be larger than the volume of exports of a
small country like Uruguay. By the same token, we expect the export volume of We use this measure to construct a matrix that connects each country to
products that represent a large fraction of world trade, such as cars or footwear, the products that it makes. the entries in the matrix are 1 if country exports
to represent a larger share of a country’s exports than products that account for product with revealed Comparative advantage larger than 1, and o otherwise.
a small fraction of world trade, like cotton seed oil or potato flour. Formally we define this as the matrix, where
to make countries and products comparable we use Balassa’s definition of
revealed Comparative advantage or rCa. Balassa’s definition says that a coun-
try has revealed Comparative advantage in a product if it exports more than its
“fair” share, that is, a share that is equal to the share of total world trade that
the product represents. For example, in 2008, with exports of $42 billion, soy-
beans represented 0.35% of world trade. of this total, Brazil exported nearly $11
billion, and since Brazil’s total exports for that year were $140 billion, soybeans is the matrix summarizing which country makes what, and is used to
accounted for 7.8% of Brazil’s exports. this represents around 21 times Brazil’s construct the product space and our measures of economic complexity for
“fair share” of soybean exports (7.8% divided by 0.35%), so we can say that countries and products. in our research we have played around with cutoff
Brazil has revealed comparative advantage in soybeans. values other than 1 to construct the matrix and found that our results are
Formally, if represents the exports of country in product , we can robust to these changes.
express the revealed Comparative advantage that country has in product as: going forward, we smooth changes in export volumes induced by the price
fluctuation of commodities by using a modified definition of rCa in which the
denominator is averaged over the previous three years.