
Page 21 - The Atlas of Economic Complexity
P. 21
22 | THE ATLAS OF ECONOMIC COMPLEXITY
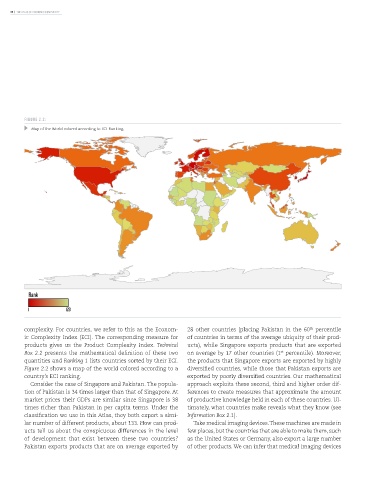
FIGURE 2.2:
Map of the World colored according to ECI Ranking.
Rank
1 128
th
complexity. For countries, we refer to this as the Econom- 28 other countries (placing Pakistan in the 60 percentile
ic Complexity Index (ECI). The corresponding measure for of countries in terms of the average ubiquity of their prod-
products gives us the Product Complexity Index. Technical ucts), while Singapore exports products that are exported
Box 2.2 presents the mathematical definition of these two on average by 17 other countries (1 percentile). Moreover,
st
quantities and Ranking 1 lists countries sorted by their ECI. the products that Singapore exports are exported by highly
Figure 2.2 shows a map of the world colored according to a diversified countries, while those that Pakistan exports are
country’s ECI ranking. exported by poorly diversified countries. Our mathematical
Consider the case of Singapore and Pakistan. The popula- approach exploits these second, third and higher order dif-
tion of Pakistan is 34 times larger than that of Singapore. At ferences to create measures that approximate the amount
market prices their GDPs are similar since Singapore is 38 of productive knowledge held in each of these countries. Ul-
times richer than Pakistan in per capita terms. Under the timately, what countries make reveals what they know (see
classification we use in this Atlas, they both export a simi- Information Box 2.1).
lar number of different products, about 133. How can prod- Take medical imaging devices. These machines are made in
ucts tell us about the conspicuous differences in the level few places, but the countries that are able to make them, such
of development that exist between these two countries? as the United States or Germany, also export a large number
Pakistan exports products that are on average exported by of other products. We can infer that medical imaging devices