
Page 27 - The Atlas of Economic Complexity
P. 27
28 | THE ATLAS OF ECONOMIC COMPLEXITY
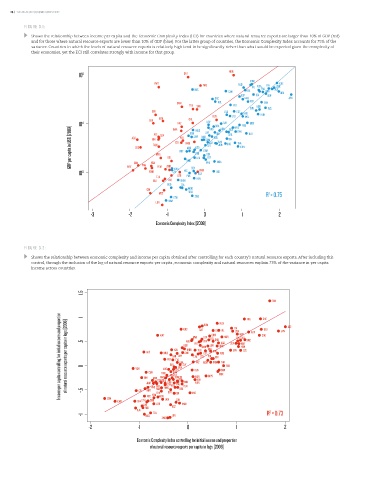
FIGURE 3.1:
Shows the relationship between income per capita and the Economic Complexity Index (ECI) for countries where natural resource exports are larger than 10% of GDP (red)
and for those where natural resource exports are lower than 10% of GDP (blue). For the latter group of countries, the Economic Complexity Index accounts for 75% of the
variance. Countries in which the levels of natural resource exports is relatively high tend to be significantly richer than what would be expected given the complexity of
their economies, yet the ECI still correlates strongly with income for that group.
NOR
10 5 QAT
DNK
KWT NLD CHE
ARE IRL USA FIN SWE
AUS BEL FRA AUT
CAN GBR DEU
ESP ITA SGP
GRC HKG JPN
OMN NZL ISR SVN
TTO SAU PRT SVK KOR CZE
LBY LVA EST HRV
RUS LTU POL HUN
GAB VEN CHL URY
10 4 AZE DZA BWA KAZ CUB MUS ZAF ARG BRA LBN TUR SRB MYS PAN ROU BLR
MEX
GDP per capita in USD [2009] AGO COG IRN MNG BOL ECU PRY NAM JAM GEO MKD DOM ALB COL TUN UKR BIH THA CHN
BGR
CRI
PER
JOR
TKM
SLV
MAR
GTM
SYR
IDN
EGY
LKA
MDA
NGA
VNM
10 3 MRT SDN PNG CMR YEM ZMB CIV GHA NIC HND SEN KGZ PHL IND
TJK UZB PAK KEN
MLI LAO KHM
BGD TZA
GIN MDG
2
MOZ UGA R = 0.75
ETH ZWE
LBR MWI
-3 -2 -1 0 1 2
Economic Complexity Index [2008]
FIGURE 3.2:
Shows the relationship between economic complexity and income per capita obtained after controlling for each country’s natural resource exports. After including this
control, through the inclusion of the log of natural resource exports per capita, economic complexity and natural resources explain 73% of the variance in per capita
income across countries.
1.5
SVN AZE
Income per capita controlling for initial income and proportion of natural resource exports per capita in logs [2008] .5 0 VEN IRN AUS CUB MAR MKD ARG PRY DZA GAB URY LKA SLV CAN KHM MWI KAZ TUR QAT OMN HKG JOR LBN PAN DNK MEX NOR BLR SGP SVK USA GBR CZE SWE AUT COG DEU JPN
1
FRA
CHE
NLD
DOM
ITA
GRC
ESP IRL
KWT
LBY
FIN SAU
BEL
CRI
ARE
AGO
PRT
KOR
BGD
HRV
HUN
NZL
SRB
MUS
EST
ROU
POL
LVA LTU
ISR
TTO
THA
MDA
BRA
CHL
RUS
CHN
BWA
TKM
ALBZAF
MYS
BGR
SENCOL
NAM
PER ECU PAK
HND GEO
MNG
BOL
-.5
MRT
CIV
EGY
SYR
IDN
NCC
SDN
UGA
GIN
CMR GHA ETH JAM ZMB YEM NGA MDG O GTM KEN PNG PHL TUN IND UKR BIH
LAO UZB VNM
MLI KGZ
TJK 2
-1 MOZ TZA LBR R = 0.73
ZWE
-2 -1 0 1 2
Economic Complexity Index controlling for initial income and proportion
of natural resource exports per capita in logs [2008]