
Page 29 - The Atlas of Economic Complexity
P. 29
30 | THE ATLAS OF ECONOMIC COMPLEXITY
t e c h n I c a l B o x 3 . 1 : t h e g r o w t h r e g r e s s I o n
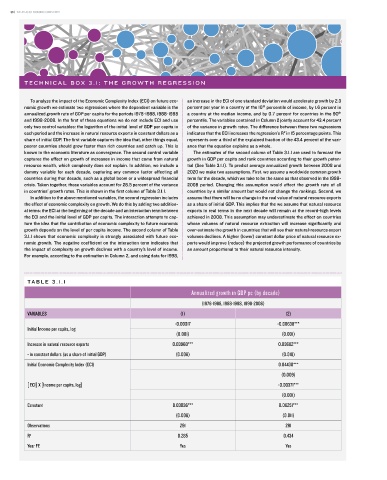
to analyze the impact of the economic Complexity index (eCi) on future eco- an increase in the eCi of one standard deviation would accelerate growth by 2.3
th
nomic growth we estimate two regressions where the dependent variable is the percent per year in a country at the 10 percentile of income, by 1.6 percent in
th
annualized growth rate of gDp per capita for the periods 1978-1988, 1988-1998 a country at the median income, and by 0.7 percent for countries in the 90
and 1998-2008. in the first of these equations we do not include eCi and use percentile. the variables contained in Column 2 jointly account for 43.4 percent
only two control variables: the logarithm of the initial level of gDp per capita in of the variance in growth rates. the difference between these two regressions
2
each period and the increase in natural resource exports in constant dollars as a indicates that the eCi increases the regression’s r in 15 percentage points. this
share of initial gDp. the first variable captures the idea that, other things equal, represents over a third of the explained fraction of the 43.4 percent of the vari-
poorer countries should grow faster than rich countries and catch up. this is ance that the equation explains as a whole.
known in the economic literature as convergence. the second control variable the estimates of the second column of table 3.1.1 are used to forecast the
captures the effect on growth of increases in income that come from natural growth in gDp per capita and rank countries according to their growth poten-
resource wealth, which complexity does not explain. in addition, we include a tial (see table 3.1.1). to predict average annualized growth between 2008 and
dummy variable for each decade, capturing any common factor affecting all 2020 we make two assumptions. First, we assume a worldwide common growth
countries during that decade, such as a global boom or a widespread financial term for the decade, which we take to be the same as that observed in the 1998-
crisis. taken together, these variables account for 28.5 percent of the variance 2008 period. Changing this assumption would affect the growth rate of all
in countries’ growth rates. this is shown in the first column of table 3.1.1. countries by a similar amount but would not change the rankings. second, we
in addition to the above mentioned variables, the second regression includes assume that there will be no change in the real value of natural resource exports
the effect of economic complexity on growth. We do this by adding two addition- as a share of initial gDp. this implies that the we assume that natural resource
al terms: the eCi at the beginning of the decade and an interaction term between exports in real terms in the next decade will remain at the record-high levels
the eCi and the initial level of gDp per capita. the interaction attempts to cap- achieved in 2008. this assumption may underestimate the effect on countries
ture the idea that the contribution of economic complexity to future economic whose volumes of natural resource extraction will increase significantly and
growth depends on the level of per capita income. the second column of table over-estimate the growth in countries that will see their natural-resource export
3.1.1 shows that economic complexity is strongly associated with future eco- volumes declines. a higher (lower) constant dollar price of natural resource ex-
nomic growth. the negative coefficient on the interaction term indicates that ports would improve (reduce) the projected growth performance of countries by
the impact of complexity on growth declines with a country’s level of income. an amount proportional to their natural resource intensity.
For example, according to the estimation in Column 2, and using data for 1998,
TA B L E 3 . 1 . 1
Annualized growth in GDP pc (by decade)
(1978-1988, 1988-1998, 1998-2008)
VARIABLES (1) (2)
-0.00017 -0.00638***
Initial Income per capita, log
(0.001) (0.001)
Increase in natural resource exports 0.03960*** 0.03682***
- in constant dollars (as a share of initial GDP) (0.008) (0.010)
Initial Economic Complexity Index (ECI) 0.04430***
(0.009)
[ ECI] X [Income per capita, log] -0.00371***
(0.001)
Constant 0.03036*** 0.08251***
(0.008) (0.011)
Observations 291 291
R 2 0.285 0.434
Year FE Yes Yes