
Page 52 - The Atlas of Economic Complexity
P. 52
MAPPING PATHS TO PROSPERITY | 53
t e c h n I c a l B o x 5 . 3 : I d e n t I f y I n g p r o d u c t c o m m u n I t I e s
in network science, groups of highly interconnected nodes are known as
communities. in the product space, communities represent groups of products
that are likely to require many of the same capabilities.
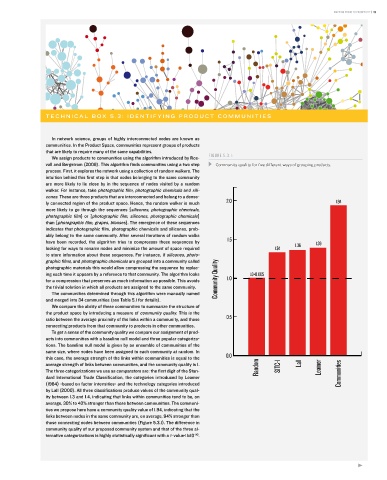
We assign products to communities using the algorithm introduced by ros- FIGURE 5.3.1:
vall and Bergstrom (2008). this algorithm finds communities using a two step Community quality for five different ways of grouping products.
process. First, it explores the network using a collection of random walkers. the
intuition behind this first step is that nodes belonging to the same community
are more likely to lie close by in the sequence of nodes visited by a random
walker. For instance, take photographic film, photographic chemicals and sili-
cones. these are three products that are interconnected and belong to a dense-
ly connected region of the product space. hence, the random walker is much 2.0 1.94
more likely to go through the sequences {silicones, photographic chemicals,
photographic film} or {photographic film, silicones, photographic chemicals}
than {photographic film, grapes, blouses}. the emergence of these sequences
indicates that photographic film, photographic chemicals and silicones, prob-
ably belong to the same community. after several iterations of random walks
have been recorded, the algorithm tries to compresses these sequences by 1.5 1.36 1.39
looking for ways to rename nodes and minimize the amount of space required 1.34
to store information about these sequences. For instance, if silicones, photo-
graphic films, and photographic chemicals are grouped into a community called
photographic materials this would allow compressing the sequence by replac-
ing each time it appears by a reference to that community. the algorithm looks 1.0+0.005
for a compression that preserves as much information as possible. this avoids Community Quality 1.0
the trivial solution in which all products are assigned to the same community.
the communities determined through this algorithm were manually named
and merged into 34 communities (see table 5.1 for details).
We compare the ability of these communities to summarize the structure of
the product space by introducing a measure of community quality. this is the
ratio between the average proximity of the links within a community, and those 0.5
connecting products from that community to products in other communities.
to get a sense of the community quality we compare our assignment of prod-
ucts into communities with a baseline null model and three popular categoriza-
tions. the baseline null model is given by an ensemble of communities of the
same size, where nodes have been assigned to each community at random. in
this case, the average strength of the links within communities is equal to the 0.0
average strength of links between communities, and the community quality is 1. Random SITC-1 Lall Leamer
the three categorizations we use as comparators are: the first digit of the stan- Communities
dard international trade Classification, the categories introduced by Leamer
(1984) -based on factor intensities- and the technology categories introduced
by Lall (2000). all three classifications produce values of the community qual-
ity between 1.3 and 1.4, indicating that links within communities tend to be, on
average, 30% to 40% stronger than those between communities. the communi-
ties we propose here have a community quality value of 1.94, indicating that the
links between nodes in the same community are, on average, 94% stronger than
those connecting nodes between communities (Figure 5.3.1). the difference in
community quality of our proposed community system and that of the three al-
ternative categorizations is highly statistically significant with a -value<1x10 .
-30