
Page 47 - The Atlas of Economic Complexity
P. 47
48 | THE ATLAS OF ECONOMIC COMPLEXITY
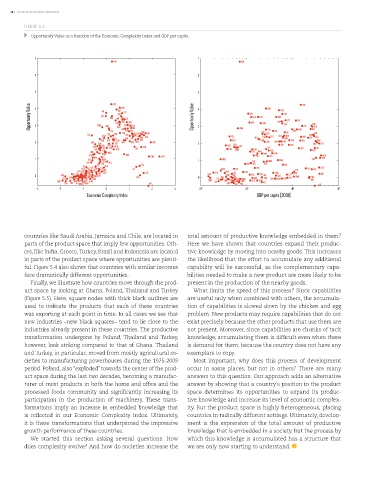
FIGURE 5.4:
Opportunity Value as a function of the Economic Complexity Index and GDP per capita.
7 7
IND IND
6 6
5 GRC 5
Opportunity Value 4 EGY BRA LVA TUR BGR LTU EST CHN Opportunity Value 4 IDN UKR SRB EGY CHN BGR LBN TUR LTU EST PRT GRC CAN
IDN
SRB
BRA
LBN PRT
UKR
LVA
VNM
3
ARG
ROU
ZAF CAN THA ESP HRV NLD BEL GBR 3 VNM BIH THA ZAF HR ARG ROU ESP BEL NLD
TZA COL TUN BIH POL BLR HUN FIN BLR GBR FIN
MEX
GTM NZL PAN ISR KOR SGP TZA ALB TUN COL POL HUN KOR ISR SGP
MEX
2 UGA SEN KEN ALB CRI JOR MYS HKG DNK SVK CHE 2 KEN SEN GTM JOR MYS CRI PAN SVK NZL HKG DNK CHE
PAK SYR KGZ URY SLV MDA SVN UGA PAK SLV URY
AUS LKA RUS IRL KGZ MDA SYR RUS SVN AUS IRL
HND MAR MKD LKA MAR MKD DOM
PER MUS DOM NOR SWE JPN HND PER NOR
1 KAZ MDG NAM 1 MDG MUS SWE JPN
NIC CHL GEO PHL USA NIC PHL KAZ NAM
GEO
CIV PRY ARE CHL
GHA ETH UZB ZWE TTO ITA ZWE CIV PRY TTO ITA ARE USA
JAM
DZA LBR LAO ECU QAT SAU CZE ETH GHA LAO UZB JAM SAU
BOL
0 AG0 NGA LBY MLI MOZ BGD OMN CUB LBR MOZ BGD BOL ECU IRN CUB CZE OMN FRA QAT
MWI
COG GIN GAB YEM ZMB BWA FRA 0 TCD MLI NGA YEM MNG AGO DZA GAB BWA VEN LBY
TJK
MRT CMR TKM VEN KHM MWI TJK ZMB GIN KHM CMR COG TKM AZE KWT
SDN PNG AZE MNG IRN KWT AUT MRT SDN PNG AUT
-3 -2 -1 0 1 2 3 10 2 10 3 10 4 10 5
Economic Complexity Index GDP per capita [2008]
countries like Saudi Arabia, Jamaica and Chile, are located in total amount of productive knowledge embedded in them?
parts of the product space that imply few opportunities. Oth- Here we have shown that countries expand their produc-
ers, like India, Greece, Turkey, Brazil and Indonesia are located tive knowledge by moving into nearby goods. This increases
in parts of the product space where opportunities are plenti- the likelihood that the effort to accumulate any additional
ful. Figure 5.4 also shows that countries with similar incomes capability will be successful, as the complementary capa-
face dramatically different opportunities. bilities needed to make a new product are more likely to be
Finally, we illustrate how countries move through the prod- present in the production of the nearby goods.
uct space by looking at Ghana, Poland, Thailand and Turkey What limits the speed of this process? Since capabilities
(Figure 5.5). Here, square nodes with thick black outlines are are useful only when combined with others, the accumula-
used to indicate the products that each of these countries tion of capabilities is slowed down by the chicken and egg
was exporting at each point in time. In all cases we see that problem. New products may require capabilities that do not
new industries –new black squares– tend to lie close to the exist precisely because the other products that use them are
industries already present in these countries. The productive not present. Moreover, since capabilities are chunks of tacit
transformation undergone by Poland, Thailand and Turkey, knowledge, accumulating them is difficult even when there
however, look striking compared to that of Ghana. Thailand is demand for them, because the country does not have any
and Turkey, in particular, moved from mostly agricultural so- exemplars to copy.
cieties to manufacturing powerhouses during the 1975-2009 Most important, why does this process of development
period. Poland, also “exploded” towards the center of the prod- occur in some places, but not in others? There are many
uct space during the last two decades, becoming a manufac- answers to this question. Our approach adds an alternative
turer of most products in both the home and office and the answer by showing that a country’s position in the product
processed foods community and significantly increasing its space determines its opportunities to expand its produc-
participation in the production of machinery. These trans- tive knowledge and increase its level of economic complex-
formations imply an increase in embedded knowledge that ity. But the product space is highly heterogeneous, placing
is reflected in our Economic Complexity Index. Ultimately, countries in radically different settings. Ultimately, develop-
it is these transformations that underpinned the impressive ment is the expression of the total amount of productive
growth performance of these countries. knowledge that is embedded in a society. But the process by
We started this section asking several questions: How which this knowledge is accumulated has a structure that
does complexity evolve? And how do societies increase the we are only now starting to understand.