
Page 205 - Engineering Mathematics Workbook_Final
P. 205
Probability & Statistics
Then the value of ‘a’ and Prob (c) 1 ,2
X 0 , respectively, are 2 (d) {1, 2}
1 1 [ESE 2017 (EE)]
(a) 2, (b) 4,
2 2
263. The graph of a function f(x) is shown
1 1 in the figure.
(c) 2, (d) 4,
4 4
[GATE-2016 EC SET-3]
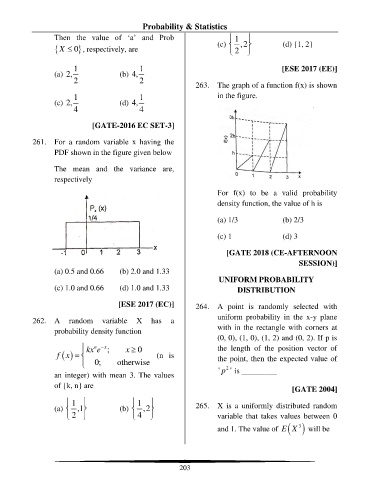
261. For a random variable x having the
PDF shown in the figure given below
The mean and the variance are,
respectively
For f(x) to be a valid probability
density function, the value of h is
(a) 1/3 (b) 2/3
(c) 1 (d) 3
[GATE 2018 (CE-AFTERNOON
SESSION)]
(a) 0.5 and 0.66 (b) 2.0 and 1.33
UNIFORM PROBABILITY
(c) 1.0 and 0.66 (d) 1.0 and 1.33 DISTRIBUTION
[ESE 2017 (EC)] 264. A point is randomly selected with
uniform probability in the x-y plane
262. A random variable X has a
probability density function with in the rectangle with corners at
(0, 0), (1, 0), (1, 2) and (0, 2). If p is
kx e x ; x 0 the length of the position vector of
n −
f ( ) x = (n is
0; otherwise the point, then the expected value of
2
'
an integer) with mean 3. The values ' p is _________
of {k, n} are
[GATE 2004]
1 1
(a) ,1 (b) ,2 265. X is a uniformly distributed random
2 4 variable that takes values between 0
3
E X
and 1. The value of ( ) will be
203