
Page 221 - Basic Course
P. 221
KNX BASIC COURSE
Presuming that solution 2 is implemented, we now proceed to the second part of the
study:
11.3 Determining the bus loads
11.3.1 Scenario 1:
According to the parameterisation of the components, the specified functions can lead to
a noticeable telegram load on the planned bus line.
Status signals that are sent automatically in a 3-row lighting circuit with a sampling rate of
one 1 second, also generate between 3 and 6 telegrams (!) per second. That makes 3x
the 8-bit brightness value + (when switching on/off) the 1-bit switching state. We know that
there can never be more than approximately 48 telegrams per second and with maximum
cable length only 24 telegrams per second (the latter is however not the case here).
However, we have 8 lighting circuits. If you multiply this with the numbers above, this
already results in 48 in the worst case. However, many other bus devices also send out
telegrams simultaneously on a regular basis! The scenario could look like this in the worst
case:
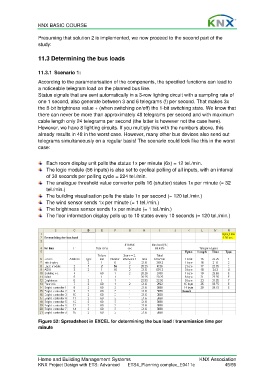
Each room display unit polls the status 1x per minute (6x) = 12 tel./min.
The logic module (56 inputs) is also set to cyclical polling of all inputs, with an interval
of 30 seconds per polling cycle = 224 tel./min.
The analogue threshold value converter polls 16 (shutter) states 1x per minute (= 32
tel./min.)
The building visualisation polls the state 1x per second (= 120 tel./min.)
The wind sensor sends 1x per minute (= 1 tel./min.)
The brightness sensor sends 1x per minute (= 1 tel./min.)
The floor information display polls up to 10 states every 10 seconds (= 120 tel./min.)
Figure 52: Spreadsheet in EXCEL for determining the bus load / transmission time per
minute
Home and Building Management Systems KNX Association
KNX Project Design with ETS: Advanced ETS4_Planning complex_E0411c 45/59