
Page 6 - GeoPRISMS_Newsletter_Spring2019_42_Neat
P. 6
Complex upper mantle structure beneath the
East African Rift System
Erica Emry (New Mexico Tech), Andrew Nyblade (Penn State University), and
Yang Shen (University of Rhode Island)
he East African Rift System (EARS) was one of the GeoPRISMS primary sites within the theme of Rift Initiation and Evolution,
because of the variety of rifting stages and styles exhibited along this margin and because of the number of science questions that
Tcan be addressed there. Along this margin and in neighboring regions of Africa, Europe, and the Middle East, many broadband
seismic instruments have been previously deployed, and numerous studies have explored the subsurface structure over a broad range of
scales. However, there is often a disjoint between features that had been previously imaged through smaller-scale, regional tomographic
inversions and those imaged by larger-scale inversions. In a recent tomographic study of the upper mantle beneath Africa, we used a full-
waveform tomography method, constrained by long-period signal from ambient seismic noise to image the upper mantle beneath Africa
to the top of the mantle transition zone (Emry et al., 2019). We found good agreement with prior models, at both large and regional scales,
and we imaged new features in higher detail beneath more poorly resolved segments of the EARS. Here, we highlight the overall patterns
along the EARS and focus on the complexity observed beneath the Turkana region.
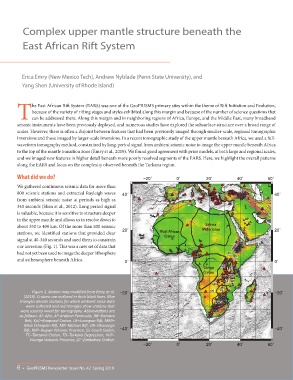
What did we do? −20˚ 0˚ 20˚ 40˚ 60˚
We gathered continuous seismic data for more than
800 seismic stations and extracted Rayleigh waves 40˚ 40˚
from ambient seismic noise at periods as high as
340 seconds (Shen et al., 2012). Long period signal
is valuable, because it is sensitive to structure deeper
in the upper mantle and allows us to resolve down to AP
Sahara
about 350 to 400 km. Of the more than 800 seismic Metacraton
stations, we identified stations that provided clear 20˚ West African 20˚
Craton
signal at 40-340 seconds and used them to constrain AF
our inversion (Fig. 1). This was a new set of data that MER
had not yet been used to image the deeper lithosphere SS
and asthenosphere beneath Africa. 0˚ TD 0˚
Congo VVP TC
Craton
RVP
LR MR
DB
Figure 1. Station map modified from Emry et al. −20˚ OR ZC −20˚
(2019). Cratons are outlined in thick black lines. Blue
triangles denote stations for which ambient noise data KpC
were collected and red triangles show stations that
were used to invert for tomography. Abbreviations are
as follows: AF-Afar, AP-Arabian Peninsula, DB–Damara
Belt, KpC–Kaapvaal Craton, LR–Luangwa Rift, MER–
Main Ethiopian Rift, MR–Malawi Rift, OR–Okavango
Rift, RVP–Rugwe Volcanic Province, SS–South Sudan, −40˚ −40˚
TC–Tanzania Craton, TD–Turkana Depression, VVP–
Virunga Volcanic Province, ZC–Zimbabwe Craton.
−20˚ 0˚ 20˚ 40˚ 60˚
6 • GeoPRISMS Newsletter Issue No. 42 Spring 2019