
Page 7 - GeoPRISMS_Newsletter_Spring2019_42_Neat
P. 7
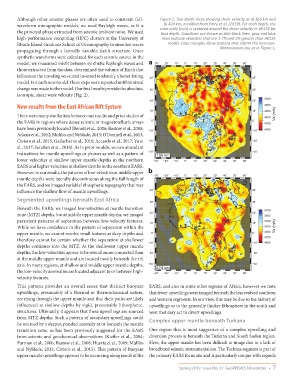
Although other seismic phases are often used to constrain full-  Figure 2. Two depth slices showing shear velocity at a) 165 km and
                                                                     b) 424 km, modified from Emry et al. (2019). For each depth, the
        waveform tomographic models, we used Rayleigh waves, as it is   color scale (m/s) is centered around the shear velocity in AK135 for
        the principal phase extracted from seismic ambient noise. We used   that depth. Coastlines are shown as thin black lines, gray and blue
        high-performance computing (HPC) clusters at the University of   lines indicate velocities that are 1.7% and 5% greater than AK135
        Rhode Island Graduate School of Oceanography to simulate waves   model. Gray triangles show stations that inform the inversion.
        propagating through a laterally variable Earth structure. Once                       Abbreviations are as in Figure 1.
        synthetic waveforms were calculated for each seismic source in the
        model, we measured misfit between synthetic Rayleigh waves and  a −30˚  −20˚  −10˚  0˚  10˚  20˚  30˚  40˚  50˚  60˚
        those extracted from the data, determined the volume of Earth that
        influences the traveling wave, and inverted to identify a better-fitting   40˚                    40˚
        model. For each new model, these steps were repeated until minimal
        change was made to the model. Our final results provide the absolute,   30˚                       30˚
        isotropic, shear wave velocity (Fig. 2).                                                AP
                                                                                                               5000
                                                                20˚                                       20˚
        New results from the East African Rift System                                          AF              4800
                                                                10˚                          MER          10˚  4600
        There were many similarities between our results and prior studies of               SS  TD             4400  Vs (m/s)
        the EARS in regions where dense seismic or magnetotelluric arrays   0˚            VVP  TC         0˚   4200
        have been previously located (Benoit et al., 2006; Bastow et al., 2008;   −10˚      RVP           −10˚  4000
        Adams et al., 2012; Mulibo and Nyblade, 2013; O’Donnell et al., 2013;           DB  LR  MR
        Civiero et al., 2015; Gallacher et al., 2016; Accardo et al., 2017; Yu et   −20˚  OR  ZC          −20˚
        al., 2017; Sarafian et al., 2018). As in prior models, we saw abundant           KpC
        indications for mantle upwellings or plumes as well as a pattern of   −30˚  165 km                −30˚
        lower velocities at shallow upper mantle depths in the northern   −30˚  −20˚  −10˚  0˚  10˚  20˚  30˚  40˚  50˚  60˚
        EARS and higher velocities at shallow depths in the southern EARS.
        However, in our results, the patterns of low-velocities at middle upper   b
        mantle depths were laterally discontinuous along the full length of   −30˚  −20˚  −10˚  0˚  10˚  20˚  30˚  40˚  50˚  60˚
        the EARS, and we imaged variable lithospheric topography that may
        influence the shallow flow of mantle upwellings.        40˚                                       40˚
        Segmented upwellings beneath East Africa                30˚                                       30˚
        Beneath the EARS, we imaged low-velocities at mantle transition                                        5700
        zone (MTZ) depths, but at middle upper mantle depths, we imaged   20˚                             20˚  5500
        persistent patterns of separation between low-velocity features.   10˚                            10˚  5300
        While we have confidence in the pattern of separation within the                                       5100  Vs (m/s)
        upper mantle, we cannot resolve small features at deep depths and   0˚                            0˚   4900
        therefore cannot be certain whether the separation at shallower                                        4700
        depths continues into the MTZ. At the shallowest upper mantle   −10˚                              −10˚  4500
        depths, the low-velocities appear to be overall more connected than   −20˚                        −20˚
        at the middle upper mantle and are located mostly beneath the rift
        axis. In many regions, at shallow and middle upper mantle depths,   −30˚  424 km                  −30˚
        the low-velocity anomalies are located adjacent to or between high-  −30˚  −20˚  −10˚  0˚  10˚  20˚  30˚  40˚  50˚  60˚
        velocity features.
        This pattern provides an overall sense that distinct buoyant  EARS, and also in some other regions of Africa, however we note
        upwellings, presumably of a thermal or thermochemical nature,  that fewer upwellings were imaged beneath the less evolved southern
        are rising through the upper mantle and that their paths are likely  and western segments. In our view, this may be due to the history of
        influenced at shallow depths by rigid, presumably lithospheric,  upwellings or to the generally thicker lithosphere in the south and
        structures. Ultimately, it appears that these upwellings are sourced  west that may act to divert upwellings.
        from MTZ depths. Such a pattern of secondary upwellings could
        be sourced by a deeper, ponded anomaly at or beneath the mantle   Complex upper mantle beneath Turkana
        transition zone, as has been previously suggested for the EARS  One region that is most suggestive of a complex upwelling and
        from seismic and geochemical observations (Kieffer et al., 2004;  diversion process is beneath the Turkana and South Sudan region.
        Furman et al., 2006; Bastow et al., 2008; Huerta et al., 2009; Mulibo  Here, the upper mantle has been difficult to image due to a lack of
        and Nyblade, 2013; Civiero et al., 2015). This pattern of buoyant  broadband seismic instrumentation. The Turkana segment is part of
        upper mantle upwellings appears to be occurring along much of the  the primary EARS focus site and is particularly unique with regards

                                                                            Spring 2019  Issue No. 42  GeoPRISMS Newsletter  •  7