
Page 46 - MODULE QUALITY TOOLS DMQ 30262
P. 46
DMQ 30262
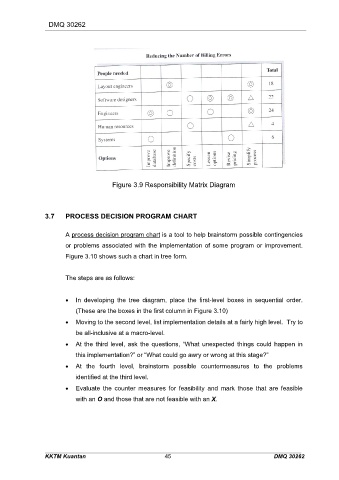
Figure 3.9 Responsibility Matrix Diagram
3.7 PROCESS DECISION PROGRAM CHART
A process decision program chart is a tool to help brainstorm possible contingencies
or problems associated with the implementation of some program or improvement.
Figure 3.10 shows such a chart in tree form.
The steps are as follows:
In developing the tree diagram, place the first-level boxes in sequential order.
(These are the boxes in the first column in Figure 3.10)
Moving to the second level, list implementation details at a fairly high level. Try to
be all-inclusive at a macro-level.
At the third level, ask the questions, “What unexpected things could happen in
this implementation?” or “What could go awry or wrong at this stage?”
At the fourth level, brainstorm possible countermeasures to the problems
identified at the third level.
Evaluate the counter measures for feasibility and mark those that are feasible
with an O and those that are not feasible with an X.
KKTM Kuantan 45 DMQ 30262