
Page 51 - MODULE QUALITY TOOLS DMQ 30262
P. 51
DMQ 30262
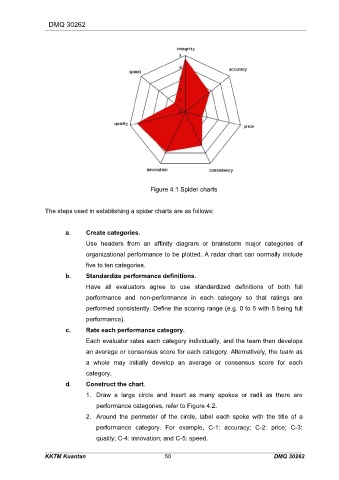
Figure 4.1 Spider charts
The steps used in establishing a spider charts are as follows:
a. Create categories.
Use headers from an affinity diagram or brainstorm major categories of
organizational performance to be plotted. A radar chart can normally include
five to ten categories.
b. Standardize performance definitions.
Have all evaluators agree to use standardized definitions of both full
performance and non-performance in each category so that ratings are
performed consistently. Define the scoring range (e.g. 0 to 5 with 5 being full
performance).
c. Rate each performance category.
Each evaluator rates each category individually, and the team then develops
an average or consensus score for each category. Alternatively, the team as
a whole may initially develop an average or consensus score for each
category.
d. Construct the chart.
1. Draw a large circle and insert as many spokes or radii as there are
performance categories, refer to Figure 4.2.
2. Around the perimeter of the circle, label each spoke with the title of a
performance category. For example, C-1: accuracy; C-2: price; C-3:
quality; C-4: innovation; and C-5: speed.
KKTM Kuantan 50 DMQ 30262