
Page 10 - analysis-and-interpretation-of-astronomical-sp
P. 10
Analysis and Interpretation of Astronomical Spectra 10
3 The Continuum
3.1 Black Body Radiation and the Course of the Continuum Level
The red curve, hereafter referred to as continuum level corresponds to the course of the
radiation intensity or flux density, plotted over the wavelength, increasing from left to right.
As a fit to the blue continuum it is cleaned by any existing absorption or emission lines
(blue curve). The entire area between the horizontal wavelength axis and the continuum
level is called continuum [5].
Continuum Level Ic
Continuum
Most important physical basis for the origin and course of the continuum is the so-called
black body radiation. The blackbody is a theoretical working model which, in that perfec-
tion, doesn’t exist in nature.
For most amateurs it is sufficient to know, that:
– The blackbody is an ideal absorber which absorbs broadband electromagnetic radiation,
regardless of the wavelength, completely and uniformly.
– The ideal black body represents a thermal radiation source, which emits a broad-band
electromagnetic radiation, according to the Planck's radiation law, with an exclusively
temperature-dependent intensity profile.
– Stars in most cases may simplified be considered as black-body radiators.
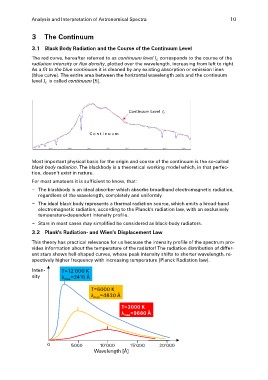
3.2 Plank's Radiation- and Wien's Displacement Law
This theory has practical relevance for us because the intensity profile of the spectrum pro-
vides information about the temperature of the radiator! The radiation distribution of differ-
ent stars shows bell-shaped curves, whose peak intensity shifts to shorter wavelength, re-
spectively higher frequency with increasing temperature (Planck Radiation law).
Inten- T=12‘000 K
sity λmax=2415 Å
T=6000 K
λmax=4830 Å
T=3000 K
λmax=9660 Å
0 5000 10‘000 15‘000 20‘000
Wavelength [Å]