
Page 15 - analysis-and-interpretation-of-astronomical-sp
P. 15
Analysis and Interpretation of Astronomical Spectra 15
5 Typology of the Spectra
5.1 Continuous Spectrum
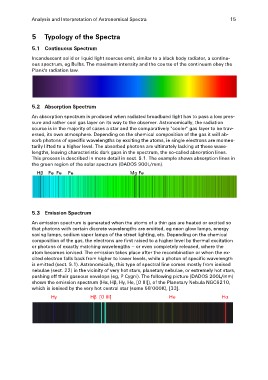
Incandescent solid or liquid light sources emit, similar to a black body radiator, a continu-
ous spectrum, eg Bulbs. The maximum intensity and the course of the continuum obey the
Plank's radiation law.
5.2 Absorption Spectrum
An absorption spectrum is produced when radiated broadband light has to pass a low pres-
sure and rather cool gas layer on its way to the observer. Astronomically, the radiation
source is in the majority of cases a star and the comparatively "cooler" gas layer to be trav-
ersed, its own atmosphere. Depending on the chemical composition of the gas it will ab-
sorb photons of specific wavelengths by exciting the atoms, ie single electrons are momen-
tarily lifted to a higher level. The absorbed photons are ultimately lacking at these wave-
lengths, leaving characteristic dark gaps in the spectrum, the so-called absorption lines.
This process is described in more detail in sect. 9.1. The example shows absorption lines in
the green region of the solar spectrum (DADOS 900L/mm).
Hβ Fe Fe Fe Mg Fe
5.3 Emission Spectrum
An emission spectrum is generated when the atoms of a thin gas are heated or excited so
that photons with certain discrete wavelengths are emitted, eg neon glow lamps, energy
saving lamps, sodium vapor lamps of the street lighting, etc. Depending on the chemical
composition of the gas, the electrons are first raised to a higher level by thermal excitation
or photons of exactly matching wavelengths – or even completely released, where the
atom becomes ionised. The emission takes place after the recombination or when the ex-
cited electron falls back from higher to lower levels, while a photon of specific wavelength
is emitted (sect. 9.1). Astronomically, this type of spectral line comes mostly from ionised
nebulae (sect. 22) in the vicinity of very hot stars, planetary nebulae, or extremely hot stars,
pushing off their gaseous envelops (eg, P Cygni). The following picture (DADOS 200L/mm)
shows the emission spectrum (Hα, Hβ, Hγ, He, [O III]), of the Planetary Nebula NGC6210,
which is ionised by the very hot central star (some 58‘000K), [33].
Hγ Hβ [O III] He Hα