
Page 11 - analysis-and-interpretation-of-astronomical-sp
P. 11
Analysis and Interpretation of Astronomical Spectra 11
With Wien's displacement law (German physicist Wilhelm Wien 1864-1928) and the given
wavelength [Å] of the maximum radiation intensity it is theoretically possible to
calculate the atmosphere temperature [K] of a star. This is also called “Effective tempera-
ture” or “Photosphere temperature”.
[Å]: Angström, 1 Å = 10-10m [K]: Kelvin K ≈ °Celsius + 273°
Examples: Alnitak = ca. 25‘000 K = 1‘160 Å (Ultraviolet)
Sun = ca. 5‘800 K = 4‘996 Å (Green)
Betelgeuse = ca. 3‘450 K = 8‘400 Å (Infrared)
3.3 The Pseudo Continuum
By all stellar spectra, the course of the unprocessed continuum differs strongly from the
theoretical shape of reference curves, regardless if recorded with professional or amateur
equipments. The reasons are primarily interstellar, atmospheric and instrument-specific at-
tenuation effects (telescope, spectrograph, camera), which distort the original intensity
course of the spectral profile to a so called pseudo continuum (details see sect.8.2).
Therefore, the Wien’s displacement law, on the basis of the maximum profile intensity, can
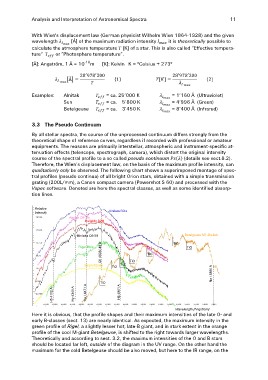
qualitatively only be observed. The following chart shows a superimposed montage of spec-
tral profiles (pseudo continua) of all bright Orion stars, obtained with a simple transmission
grating (200L/mm), a Canon compact camera (Powershot S 60) and processed with the
Vspec software. Denoted are here the spectral classes, as well as some identified absorp-
tion lines.
Relative Alnilam B0Ia
Intensity
Alnitak O9.7Ib
Bellatrix B2III
Mintaka O9.5II OII 4638/-49 A Beteigeuze M1-2Ia-Iab
Rigel B8Ia
TiO
TiO
TiO
Saiph B0.5Ia TiO Na I 5890 A
TiO TiO
TiO
Hδ 4102 A
Hγ 4340 A
He I 4471 A
Hβ 4861 A
Wavelength [Angström]
Here it is obvious, that the profile shapes and their maximum intensities of the late O- and
early B-classes (sect. 13) are nearly identical. As expected, the maximum intensity in the
green profile of Rigel, a slightly lesser hot, late-B giant, and in stark extent in the orange
profile of the cool M-giant Betelgeuse, is shifted to the right towards larger wavelengths.
Theoretically and according to sect. 3.2, the maximum intensities of the O and B stars
should be located far left, outside of the diagram in the UV range. On the other hand the
maximum for the cold Betelgeuse should be also moved, but here to the IR range, on the