
Page 94 - analysis-and-interpretation-of-astronomical-sp
P. 94
Analysis and Interpretation of Astronomical Spectra 94
20.3 Quantitative Analysis
Quantitatively analysed gets primarily the intensity deviation of the recorded hydrogen
emissions from the theoretically calculated Balmer-Decrement of the light-emitting source.
This effect is caused by the damping effects according to sect. 8.2, which selectively at-
tenuate the shortwave, blue part of the spectrum, more than the red region. The steeper the
decrement , compared to the theoretically determined values , the greater the absorb-
ance. The steeper the decrement runs, compared to theoretically calculated values ,
the stronger is the extinction of light. By convention, the intensity values are indicated in
relation to :
Inter alia, this allows the measurement of the "Interstellar Extinction" or the "Interstellar
Reddening". However the most important application, at least for amateurs, is probably the
reconstruction of the original intensity ratios of the recorded emission lines ( and -
values), which appear attenuated, even related to the continuum. This is performed using
the "template" of the theoretical Balmer-Decrement (see sect. 21.2). The proportional-
radiometric methods, as described in sect. 8.8, are not applicable here, because they can't
change the and -values and remain therefore reserved to the continuum-bound ab-
sorption lines.
The measurement of the Balmer-Decrement requires appropriate objects, radiating the
emission-lines of the H-Balmer series completely – for example most of the emission nebu-
lae, Be- and LBV stars. Representatives of the Mira Variables are unsuitable for the afore-
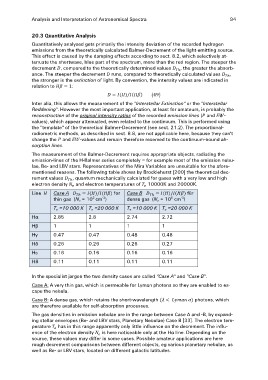
mentioned reasons. The following table shows by Brocklehurst [200] the theoretical dec-
rement values , quantum mechanically calculated for gases with a very low and high
electron density and electron temperatures of 10000K and 20000K.
Line Case A for Case B für
Hα thin gas (Ne = 102 cm-3) dense gas (Ne = 106 cm-3)
Te =10 000 K Te =20 000 K Te =10 000 K Te =20 000 K
2.85 2.8 2.74 2.72
Hβ 1 1 11
Hγ 0.47 0.47 0.48 0.48
Hδ 0.26 0.26 0.26 0.27
Hε 0.16 0.16 0.16 0.16
H8 0.11 0.11 0.11 0.11
In the specialist jargon the two density cases are called "Case A" and "Case B".
Case A: A very thin gas, which is permeable for Lyman photons so they are enabled to es-
cape the nebula.
Case B: A dense gas, which retains the short-wavelength photons, which
are therefore available for self-absorption processes.
The gas densities in emission nebulae are in the range between Case A and -B, by expand-
ing stellar envelopes (Be- and LBV stars, Planetary Nebulae) Case B [33]. The electron tem-
perature has in this range apparently only little influence on the decrement. The influ-
ence of the electron density is here noticeable only at the Hα line. Depending on the
source, these values may differ in some cases. Possible amateur applications are here
rough decrement comparisons between different objects, eg various planetary nebulae, as
well as Be- or LBV stars, located on different galactic latitudes.