
Page 48 - spectroscopic-atlas-5_0-english_Neat
P. 48
Spectroscopic Atlas for Amateur Astronomers 48
11 LBV Stars
11.1 Overview
P Cygni is one of the so-called Luminous Blue Variables (LBV), most probably progenitors of
WR stars! It’s an unstable and variable Supergiant of spectral class B2 Ia pe, with a surface
temperature of about 19,000 K. Its distance is according Karkoschka some 5000 ly. What
we analyse here with our spectrographs, apparently "realtime", took therefore really place
at the end of the Neolithic period – a genuine "time machine" at its best! At the beginning
of the 17th century, he showed a tremendous outburst, which is known as Nova Cygni
1600. After about six years as a star of the third magnitude, the brightness decreased to
<5m. Apart from a few minor episodic outbursts, the luminosity increased again in the 18th
century, until it reached the current, slightly variable value of about +4.7m to +4.9m.
11.2 Spectral Characteristics
P Cygni is the prototype for the already presented P Cygni profiles in Table 2 (Alnitak) and
Table 10 (Alnilam). Such spectral features are found in nearly all spectral classes and are a
reliable sign for a huge amount of radially ejected matter by the star. Not surprisingly this
effect is sometimes also visible in the spectra of Novae and Supernovae.
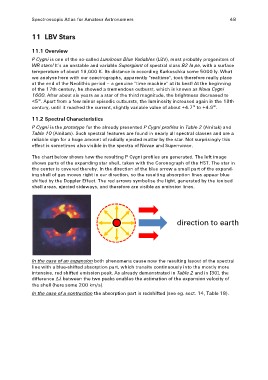
The chart below shows how the resulting P Cygni profiles are generated. The left image
shows parts of the expanding star shell, taken with the Coronograph of the HST. The star in
the center is covered thereby. In the direction of the blue arrow a small part of the expand-
ing shell of gas moves right in our direction, so the resulting absorption lines appear blue
shifted by the Doppler Effect. The red arrows symbolise the light, generated by the ionised
shell areas, ejected sideways, and therefore are visible as emission lines.
direction to earth
In the case of an expansion both phenomena cause now the resulting layout of the spectral
line with a blue-shifted absorption part, which transits continuously into the mostly more
intensive, red shifted emission peak. As already demonstrated in Table 2 and in [30], the
difference ∆ߣ between the two peaks enables the estimation of the expansion velocity of
the shell (here some 200 km/s).
In the case of a contraction the absorption part is redshifted (see eg. sect. 14, Table 18).