
Page 53 - spectroscopic-atlas-5_0-english_Neat
P. 53
Spectroscopic Atlas for Amateur Astronomers 53
kind of double peak emission. A similar structure within this wavelength domain was com-
mented in [702] by H.A. Abt as a "Disk Line".
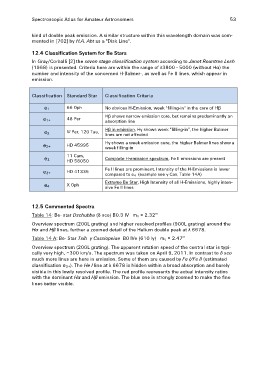
12.4 Classification System for Be Stars
In Gray/Corballi [2] the seven stage classification system according to Janet Rountree Lesh
(1968) is presented. Criteria here are within the range of λ3800 - 5000 (without Hα) the
number and intensity of the concerned H-Balmer-, as well as Fe II lines, which appear in
emission.
Classification Standard Star Classification Criteria
e1 66 Oph No obvious H-Emission, week "filling-in" in the core of Hβ
e1+ 48 Per Hβ shows narrow emission core, but remains predominantly an
absorption line
e2 Ψ Per, 120 Tau, Hβ in emission, Hγ shows week "filling-in", the higher Balmer
lines are not affected
e2+ HD 45995 Hγ shows a week emission core, the higher Balmer lines show a
week filling-in
e3 11 Cam, Complete H-emission spectrum, Fe II emissions are present
HD 58050
e3+ HD 41335 Fe II lines are prominent, Intensity of the H-Emissions is lower
compared to e4 (example see γ Cas, Table 14A)
e4 Χ Oph Extreme Be Star, High Intensity of all H-Emissions, highly inten-
sive Fe II lines
12.5 Commented Spectra
Table 14: Be- star Dschubba (δ sco) B0.3 IV mV = 2.32m
Overview spectrum (200L grating) and higher resolved profiles (900L grating) around the
Hα and Hβ lines, further a zoomed detail of the Helium double peak at λ 6678.
Table 14 A: Be- Star Tsih γ Cassiopeiae B0 IVe (610 ly) mV = 2.47m
Overview spectrum (200L grating). The apparent rotation speed of the central star is typi-
cally very high, ~300 km/s. The spectrum was taken on April 9, 2011. In contrast to δ sco
much more lines are here in emission. Some of them are caused by Fe I/Fe II (estimated
classification e3+). The He I line at λ 6678 is hidden within a broad absorption and barely
visible in this lowly resolved profile. The red profile represents the actual intensity ratios
with the dominant Hα and Hβ emission. The blue one is strongly zoomed to make the fine
lines better visible.