
Page 52 - spectroscopic-atlas-5_0-english_Neat
P. 52
Spectroscopic Atlas for Amateur Astronomers 52
12 Be Stars
12.1 Overview Unive rsity Western Ontario
Be stars form a large subgroup of the spectral class B,
and all of them show a high rotation speed. A small
number is still to find in the early A-class. These stars
are mostly located on or near the Main Sequence of
the HRD. A few Be-stars only have reached the giant
stage with an upper limit of luminosity class III. The
first Be-star, γ Cassiopeiae, was discovered in 1868
by Father Angelo Secchi, who wondered about the
"bright lines" in this spectrum.
12.2 Spectral Characteristics of Be-Stars
In contrast to the stars, showing P Cygni profiles due to expanding matter (Table 13), the
Be stars develop, often just episodically, a rotating circumstellar disk of gas in the equato-
rial plane. The mechanism is not yet fully understood. This phenomenon is accompanied by
H l and He l emissions in the spectrum, as well as strong infrared and X-ray radiation. Out-
side such episodes, the star can seemingly spend a normal “life” in the B class. Due to the
sometimes just temporary occurrence of the Be stage, the suffix e for emission lines is
missing in some stellar classification databases, which suggests that emission lines may
occur.
12.3 Textbook Example δ Scorpii
The approximately 450 ly distant δ scorpii (Dschubba), dominant member in a quadruple
star system, has mutated since about 2000 from the B0.3 IV spectral type in to a Be-star
and developed a typical circumstellar disk of gas. The apparent rotation speed of the cen-
tral star is approximately 180 km/s [505].
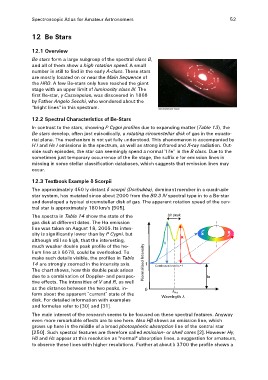
The spectra in Table 14 show the state of the ∆V peak <
gas disk at different dates. The Hα emission Normalized Intensity R Ic
line was taken on August 18, 2009. Its inten- V
sity is significantly lower than by P Cygni, but
1 Continuum level Ic=1
although still so high, that the interesting,
much weaker double peak profile of the he- 0 λHα
lium line at λ 6678, could be overlooked. To
make such details visible, the profiles in Table Wavelegth λ
14 are strongly zoomed in the intensity axis.
The chart shows, how this double peak arises
due to a combination of Doppler- and perspec-
tive effects. The intensities of V and R, as well
as the distance between the two peaks, in-
form about the apparent “current” state of the
disk. For detailed information with examples
and formulas refer to [30] and [31].
The main interest of the research seems to be focused on these spectral features. Anyway
even more remarkable effects are to see here. Also Hβ shows an emission line, which
grows up here in the middle of a broad photospheric absorption line of the central star
[250]. Such spectral features are therefore called emission- or shell cores [2]. However Hγ,
Hδ and Hε appear at this resolution as "normal" absorption lines, a suggestion for amateurs,
to observe these lines with higher resolutions. Further at about λ 3700 the profile shows a