
Page 31 - Trigonometry
P. 31
r
X? 3qLP2=
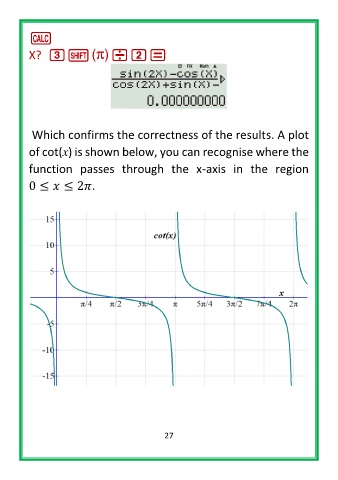
Which confirms the correctness of the results. A plot
of cot(x) is shown below, you can recognise where the
function passes through the x-axis in the region
0 ≤ ≤ 2 .
27