Page 179 - Jolliffe I. Principal Component Analysis
P. 179

6. Choosing a Subset of Principal Components or Variables
                              148
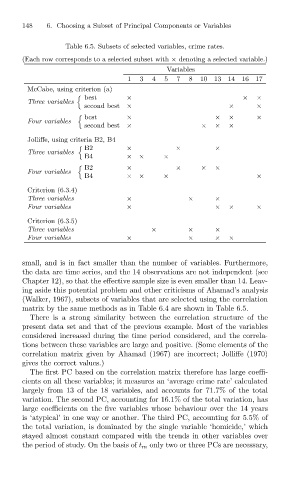
                                         Table 6.5. Subsets of selected variables, crime rates.
                              (Each row corresponds to a selected subset with × denoting a selected variable.)
                                                                    Variables
                                                         1   3  4  5  7   8  10  13 14 16 17
                               McCabe, using criterion (a)
                                              best       ×                              ×  ×
                                            "
                               Three variables
                                              second best  ×                        ×      ×
                                              best       ×                      ×   ×      ×
                                            "
                               Four variables
                                              second best  ×                 ×  ×   ×
                               Jolliffe, using criteria B2, B4
                                              B2         ×            ×         ×
                                            "
                               Three variables
                                              B4         ×  ×      ×
                                              B2         ×            ×      ×  ×
                                            "
                               Four variables
                                              B4         ×  ×      ×                       ×
                               Criterion (6.3.4)
                               Three variables           ×               ×      ×
                               Four variables            ×                      ×   ×      ×
                               Criterion (6.3.5)
                               Three variables                  ×        ×      ×
                               Four variables            ×               ×      ×   ×
                              small, and is in fact smaller than the number of variables. Furthermore,
                              the data are time series, and the 14 observations are not independent (see
                              Chapter 12), so that the effective sample size is even smaller than 14. Leav-
                              ing aside this potential problem and other criticisms of Ahamad’s analysis
                              (Walker, 1967), subsets of variables that are selected using the correlation
                              matrix by the same methods as in Table 6.4 are shown in Table 6.5.
                                There is a strong similarity between the correlation structure of the
                              present data set and that of the previous example. Most of the variables
                              considered increased during the time period considered, and the correla-
                              tions between these variables are large and positive. (Some elements of the
                              correlation matrix given by Ahamad (1967) are incorrect; Jolliffe (1970)
                              gives the correct values.)
                                The first PC based on the correlation matrix therefore has large coeffi-
                              cients on all these variables; it measures an ‘average crime rate’ calculated
                              largely from 13 of the 18 variables, and accounts for 71.7% of the total
                              variation. The second PC, accounting for 16.1% of the total variation, has
                              large coefficients on the five variables whose behaviour over the 14 years
                              is ‘atypical’ in one way or another. The third PC, accounting for 5.5% of
                              the total variation, is dominated by the single variable ‘homicide,’ which
                              stayed almost constant compared with the trends in other variables over
                              the period of study. On the basis of t m only two or three PCs are necessary,
   174   175   176   177   178   179   180   181   182   183   184