Page 276 - Jolliffe I. Principal Component Analysis
P. 276

10.1. Detection of Outliers Using Principal Components
                                                                     2
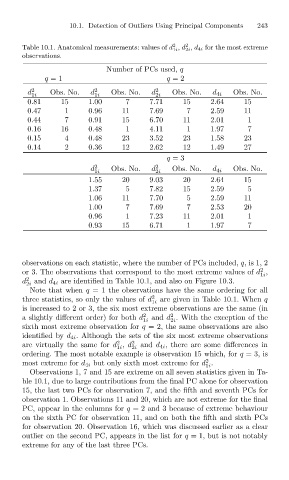
                              Table 10.1. Anatomical measurements: values of d 1i , d 2i , d 4i for the most extreme
                              observations.
                                                    Number of PCs used, q  2                243
                                    q =1                            q =2
                               d 2   Obs. No.   d 2  Obs. No.   d 2  Obs. No.        Obs. No.
                                1i               1i              2i             d 4i
                               0.81     15     1.00      7     7.71     15     2.64     15
                               0.47      1     0.96     11     7.69      7     2.59     11
                               0.44      7     0.91     15     6.70     11     2.01      1
                               0.16     16     0.48      1     4.11      1     1.97      7
                               0.15      4     0.48     23     3.52     23     1.58     23
                               0.14      2     0.36     12     2.62     12     1.49     27
                                                                    q =3
                                                d 2  Obs. No.   d 2  Obs. No.        Obs. No.
                                                 1i              2i             d 4i
                                               1.55     20     9.03     20     2.64     15
                                               1.37      5     7.82     15     2.59      5
                                               1.06     11     7.70      5     2.59     11
                                               1.00      7     7.69      7     2.53     20
                                               0.96      1     7.23     11     2.01      1
                                               0.93     15     6.71      1     1.97      7


                              observations on each statistic, where the number of PCs included, q,is1,2
                                                                                            2
                              or 3. The observations that correspond to the most extreme values of d ,
                                                                                            1i
                              d 2  and d 4i are identified in Table 10.1, and also on Figure 10.3.
                               2i
                                Note that when q = 1 the observations have the same ordering for all
                              three statistics, so only the values of d 2  are given in Table 10.1. When q
                                                                1i
                              is increased to 2 or 3, the six most extreme observations are the same (in
                                                                     2
                              a slightly different order) for both d 2  and d . With the exception of the
                                                              1i     2i
                              sixth most extreme observation for q = 2, the same observations are also
                              identified by d 4i . Although the sets of the six most extreme observations
                                                       2
                              are virtually the same for d , d 2  and d 4i , there are some differences in
                                                       1i  2i
                              ordering. The most notable example is observation 15 which, for q =3, is
                                                                              2
                              most extreme for d 4i but only sixth most extreme for d .
                                                                              1i
                                Observations 1, 7 and 15 are extreme on all seven statistics given in Ta-
                              ble 10.1, due to large contributions from the final PC alone for observation
                              15, the last two PCs for observation 7, and the fifth and seventh PCs for
                              observation 1. Observations 11 and 20, which are not extreme for the final
                              PC, appear in the columns for q = 2 and 3 because of extreme behaviour
                              on the sixth PC for observation 11, and on both the fifth and sixth PCs
                              for observation 20. Observation 16, which was discussed earlier as a clear
                              outlier on the second PC, appears in the list for q = 1, but is not notably
                              extreme for any of the last three PCs.
   271   272   273   274   275   276   277   278   279   280   281