
Page 279 - Jolliffe I. Principal Component Analysis
P. 279
10. Outlier Detection, Influential Observations and Robust Estimation
246
à
Ø
à
à
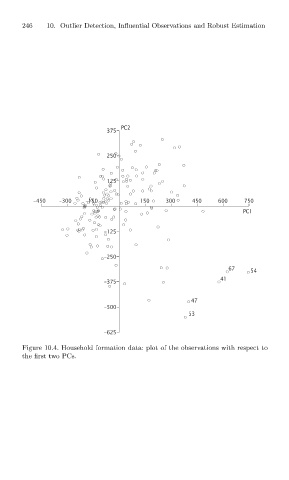
Figure 10.4. Household formation data: plot of the observations with respect to
the first two PCs.