
Page 277 - Jolliffe I. Principal Component Analysis
P. 277
10. Outlier Detection, Influential Observations and Robust Estimation
244
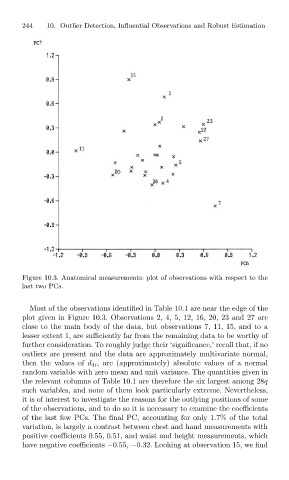
Figure 10.3. Anatomical measurements: plot of observations with respect to the
last two PCs.
Most of the observations identified in Table 10.1 are near the edge of the
plot given in Figure 10.3. Observations 2, 4, 5, 12, 16, 20, 23 and 27 are
close to the main body of the data, but observations 7, 11, 15, and to a
lesser extent 1, are sufficiently far from the remaining data to be worthy of
further consideration. To roughly judge their ‘significance,’ recall that, if no
outliers are present and the data are approximately multivariate normal,
then the values of d 4i , are (approximately) absolute values of a normal
random variable with zero mean and unit variance. The quantities given in
the relevant columns of Table 10.1 are therefore the six largest among 28q
such variables, and none of them look particularly extreme. Nevertheless,
it is of interest to investigate the reasons for the outlying positions of some
of the observations, and to do so it is necessary to examine the coefficients
of the last few PCs. The final PC, accounting for only 1.7% of the total
variation, is largely a contrast between chest and hand measurements with
positive coefficients 0.55, 0.51, and waist and height measurements, which
have negative coefficients −0.55, −0.32. Looking at observation 15, we find