
Page 146 - Budget Book FY2020-2021
P. 146
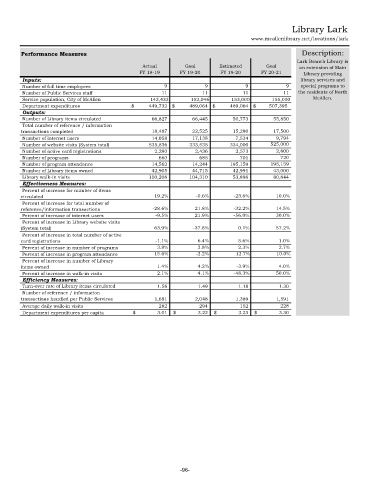
Library Lark

                                                                                  www.mcallenlibrary.net/locations/lark

      Performance Measures                                                                         Description:
                                                                                                 Lark Branch Library is
                                              Actual        Goal       Estimated       Goal       an extension of Main
                                             FY 18-19     FY 19-20      FY 19-20     FY 20-21      Library providing
      Inputs:                                                                                     library services and
      Number of full time employees                    9             9            9            9  special programs to
       Number of Public Services staff                11            11           11            11  the residents of North
       Service population, City of McAllen      143,433       152,046      153,000       155,000      McAllen.
       Department expenditures            $      449,732   $     489,064   $     489,064   $     507,395
      Outputs:
       Number of Library items circulated         66,827        66,445       50,773        55,850
       Total number of reference / information
      transactions completed                      18,487        22,525       15,280        17,500
       Number of internet users                   14,058        17,138        7,534         9,794
      Number of website visits (System total)    535,836       333,535       334,000      525,000
      Number of active card registrations          2,290         2,436        2,573         2,600
       Number of programs                            660           685          701           720
       Number of program attendance               14,562        14,244      195,159       195,159
       Number of Library items owned              42,905        44,715       42,991        43,000
       Library walk-in visits                    100,208       104,310       53,896        80,844
      Effectiveness Measures:
       Percent of increase for number of items
      circulated                                  19.2%        -0.6%        -23.6%        10.0%
       Percent of increase for total number of
      reference/information transactions         -28.6%        21.8%        -32.2%        14.5%
      Percent of increase of internet users       -9.5%        21.9%        -56.0%        30.0%
       Percent of increase in Library website visits
      (System total)                              63.9%       -37.8%         0.1%         57.2%
       Percent of increase in total number of active
      card registrations                          -1.1%         6.4%         5.6%          1.0%
      Percent of increase in number of programs    3.8%         3.8%         2.3%          2.7%
      Percent of increase in program attendance   15.6%        -2.2%         12.7%        10.0%
       Percent of increase in number of Library
      items owned                                  1.4%         4.2%         -3.9%         4.0%
       Percent of increase in walk-in visits       2.1%         4.1%        -48.3%        50.0%
      Efficiency Measures:
      Turn-over rate of Library items circulated     1.56         1.49          1.18         1.30
       Number of reference / information
      transactions handled per Public Services      1,681         2,048        1,389         1,591
      Average daily walk-in visits                   282           294          152           228
       Department expenditures per capita   $       3.01   $      3.22   $      3.23  $      3.30


                                                          -96-