Page 401 - Budget Book FY2020-2021
P. 401

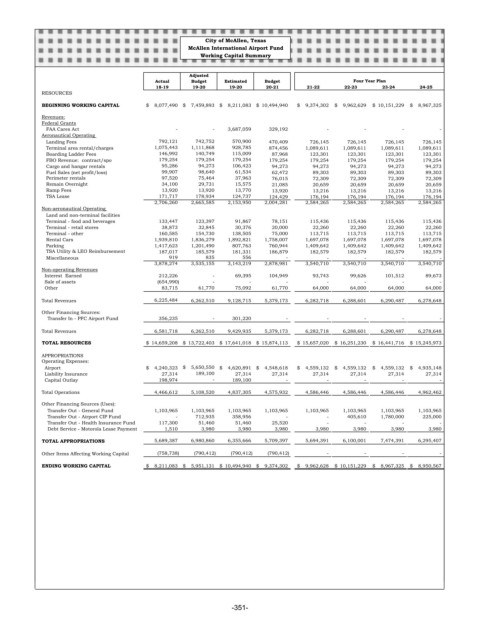
City of McAllen, Texas
                                               McAllen International Airport Fund
                                                  Working Capital Summary

                                               Adjusted
                                      Actual   Budget   Estimated  Budget                Four Year Plan
                                      18-19     19-20    19-20    20-21      21-22    22-23     23-24     24-25
         RESOURCES
         BEGINNING WORKING CAPITAL  $     8,077,490  $     7,459,893  $     8,211,083  $   10,494,940  $     9,374,302  $     9,962,629  $   10,151,229  $     8,967,325
         Revenues:
         Federal Grants
            FAA Cares Act                  -         -           3,687,059            329,192  -    -    -     -
         Aeronautical Operating
            Landing Fees                      792,121            742,752            570,900            470,409            726,145            726,145            726,145            726,145
            Terminal area rental/charges          1,075,443         1,111,868            928,785            874,456         1,089,611         1,089,611         1,089,611         1,089,611
            Boarding Ladder Fees              146,992            140,749            115,009              87,968            123,301            123,301            123,301            123,301
            FBO Revenue:  contract/spo            179,254            179,254            179,254            179,254            179,254            179,254            179,254            179,254
            Cargo and hangar rentals               95,286              94,273            106,423              94,273              94,273              94,273              94,273              94,273
            Fuel Sales (net profit/loss)               99,907              98,640              61,534              62,472              89,303              89,303              89,303              89,303
            Perimeter rentals                   97,520              75,464              37,963              76,015              72,309              72,309              72,309              72,309
            Remain Overnight                    34,100              29,731              15,575              21,085              20,659              20,659              20,659              20,659
            Ramp Fees                           13,920              13,920              13,770              13,920              13,216              13,216              13,216              13,216
            TSA Lease                         171,717            178,934            124,737            124,429            176,194            176,194            176,194            176,194
                                           2,706,260         2,665,585         2,153,950         2,004,281         2,584,265         2,584,265         2,584,265         2,584,265
         Non-aeronautical Operating
            Land and non-terminal facilities
            Terminal - food and beverages             133,447            123,397              91,867              78,151            115,436            115,436            115,436            115,436
            Terminal - retail stores               38,873              32,845              30,376              20,000              22,260              22,260              22,260              22,260
            Terminal - other                  160,585            154,730            138,505              75,000            113,715            113,715            113,715            113,715
            Rental Cars                    1,939,810         1,836,279         1,892,821         1,758,007         1,697,078         1,697,078         1,697,078         1,697,078
            Parking                        1,417,623         1,201,490            807,763            760,944         1,409,642         1,409,642         1,409,642         1,409,642
            TSA Utility & LEO Reimbursement            187,017            185,579            181,331            186,879            182,579            182,579            182,579            182,579

            Miscellaneous                 919        835      556       -         -         -        -         -
                                           3,878,274         3,535,155         3,143,219         2,878,981         3,540,710         3,540,710         3,540,710         3,540,710
         Non-operating Revenues
           Interest  Earned                   212,226  -      69,395            104,949              93,743              99,626            101,512              89,673
           Sale of assets                    (654,990)  -     -         -         -         -        -         -
           Other                                83,715              61,770              75,092              61,770              64,000              64,000              64,000              64,000
         Total Revenues                    6,225,484         6,262,510         9,128,715         5,379,173         6,282,718         6,288,601         6,290,487         6,278,648
         Other Financing Sources:
           Transfer In - PFC Airport Fund            356,235  -      301,220  -    -        -        -         -
         Total Revenues                    6,581,718         6,262,510         9,429,935         5,379,173         6,282,718         6,288,601         6,290,487         6,278,648
         TOTAL RESOURCES            $   14,659,208  $   13,722,403  $   17,641,018  $   15,874,113  $   15,657,020  $   16,251,230  $   16,441,716  $   15,245,973
         APPROPRIATIONS
         Operating Expenses:
           Airport                  $     4,240,323  $     5,650,550  $     4,620,891  $     4,548,618  $     4,559,132  $     4,559,132  $     4,559,132  $     4,935,148
           Liability Insurance                  27,314            189,100              27,314              27,314              27,314              27,314              27,314              27,314
           Capital Outlay                     198,974  -      189,100   -         -         -        -         -
         Total Operations                  4,466,612         5,108,520         4,837,305         4,575,932         4,586,446         4,586,446         4,586,446         4,962,462
         Other Financing Sources (Uses):
           Transfer Out - General Fund         1,103,965         1,103,965         1,103,965         1,103,965         1,103,965         1,103,965         1,103,965         1,103,965
           Transfer Out - Airport CIP Fund  -      712,935            358,956  -    -              405,610         1,780,000            225,000
           Transfer Out - Health Insurance Fund             117,300    51,460              51,460              25,520  -    -    -    -
           Debt Service - Motorola Lease Payment    1,510    3,980    3,980    3,980    3,980    3,980    3,980    3,980
         TOTAL APPROPRIATIONS              5,689,387         6,980,860         6,355,666         5,709,397         5,694,391         6,100,001         7,474,391         6,295,407
         Other Items Affecting Working Capital           (758,738)          (790,412)          (790,412)          (790,412)  -    -    -    -
         ENDING WORKING CAPITAL     $     8,211,083  $     5,951,131  $   10,494,940  $     9,374,302  $     9,962,628  $   10,151,229  $     8,967,325  $     8,950,567


                                                          -351-
   396   397   398   399   400   401   402   403   404   405   406