Page 399 - Budget Book FY2020-2021
P. 399

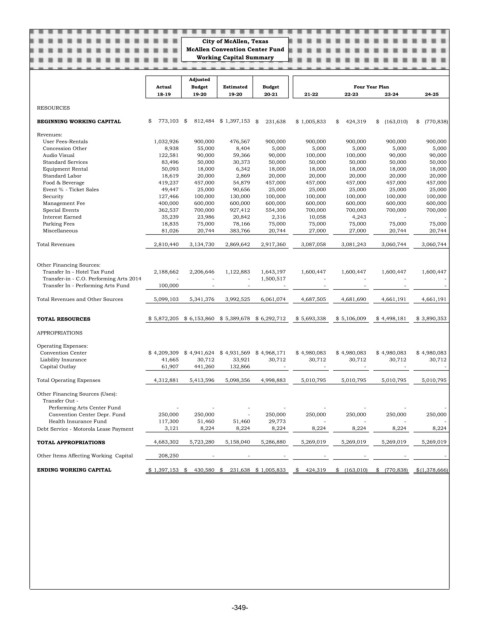
City of McAllen, Texas
                                              McAllen Convention Center Fund
                                                 Working Capital Summary

                                               Adjusted
                                      Actual   Budget   Estimated  Budget                Four Year Plan
                                       18-19    19-20    19-20    20-21     21-22      22-23     23-24     24-25
        RESOURCES
        BEGINNING WORKING CAPITAL   $      773,103  $      812,484  $   1,397,153  $      231,638  $   1,005,833  $      424,319  $     (163,010)  $     (770,838)
        Revenues:
         User Fees-Rentals               1,032,926          900,000          476,567          900,000          900,000          900,000          900,000          900,000
         Concession Other                       8,938            55,000              8,404              5,000              5,000              5,000              5,000              5,000
         Audio Visual                       122,581            90,000            59,366            90,000          100,000          100,000            90,000            90,000
         Standard Services                    83,496            50,000            30,373            50,000            50,000            50,000            50,000            50,000
         Equipment Rental                     50,093            18,000              6,342            18,000            18,000            18,000            18,000            18,000
         Standard Labor                       18,619            20,000              2,869            20,000            20,000            20,000            20,000            20,000
         Food & Beverage                    419,237          457,000            54,879          457,000          457,000          457,000          457,000          457,000
         Event % - Ticket Sales               49,447            25,000            90,656            25,000            25,000            25,000            25,000            25,000
         Security                           127,466          100,000          130,000          100,000          100,000          100,000          100,000          100,000
         Management Fee                     400,000          600,000          600,000          600,000          600,000          600,000          600,000          600,000
         Special Events                     362,537          700,000          927,412          554,300          700,000          700,000          700,000          700,000
         Interest Earned                      35,239            23,986            20,842              2,316            10,058              4,243  -    -
         Parking Fees                         18,835            75,000            78,166            75,000            75,000            75,000            75,000            75,000
         Miscellaneous                        81,026            20,744          383,766            20,744            27,000            27,000            20,744            20,744
        Total Revenues                   2,810,440       3,134,730       2,869,642       2,917,360       3,087,058       3,081,243       3,060,744       3,060,744

        Other Financing Sources:
         Transfer In - Hotel Tax Fund       2,188,662       2,206,646       1,122,883       1,643,197       1,600,447       1,600,447       1,600,447       1,600,447
         Transfer-in - C.O. Performing Arts 2014  -    -      -         1,500,517  -        -         -         -
         Transfer In - Performing Arts Fund          100,000  -    -    -        -          -         -         -
        Total Revenues and Other Sources      5,099,103       5,341,376       3,992,525       6,061,074       4,687,505       4,681,690       4,661,191       4,661,191

        TOTAL RESOURCES             $   5,872,205  $   6,153,860  $   5,389,678  $   6,292,712  $   5,693,338  $   5,106,009  $   4,498,181  $   3,890,353
        APPROPRIATIONS
        Operating Expenses:
          Convention Center         $   4,209,309  $   4,941,624  $   4,931,569  $   4,968,171  $   4,980,083  $   4,980,083  $   4,980,083  $   4,980,083
          Liability Insurance                 41,665            30,712            33,921            30,712            30,712            30,712            30,712            30,712
          Capital Outlay                      61,907          441,260          132,866  -    -    -    -        -

        Total Operating Expenses         4,312,881       5,413,596       5,098,356       4,998,883       5,010,795       5,010,795       5,010,795       5,010,795
        Other Financing Sources (Uses):
         Transfer Out -
           Performing Arts Center Fund      -        -        -        -         -          -         -         -
           Convention Center Depr. Fund          250,000          250,000  -      250,000          250,000          250,000          250,000          250,000
           Health Insurance Fund            117,300            51,460            51,460    29,773  -    -    -    -
        Debt Service - Motorola Lease Payment              3,121              8,224              8,224              8,224              8,224              8,224              8,224              8,224
        TOTAL APPROPRIATIONS             4,683,302       5,723,280       5,158,040       5,286,880       5,269,019       5,269,019       5,269,019       5,269,019

        Other Items Affecting Working  Capital          208,250  -    -    -     -          -         -         -
        ENDING WORKING CAPITAL      $   1,397,153  $      430,580  $      231,638  $   1,005,833  $      424,319  $     (163,010)  $     (770,838)  $  (1,378,666)


                                                          -349-
   394   395   396   397   398   399   400   401   402   403   404