
Page 397 - Budget Book FY2020-2021
P. 397
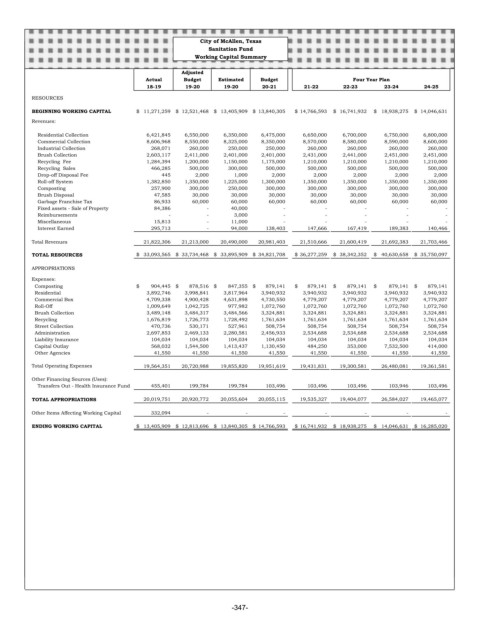
City of McAllen, Texas
                                                    Sanitation Fund
                                                Working Capital Summary
                                             Adjusted
                                    Actual   Budget   Estimated  Budget                  Four Year Plan
                                    18-19     19-20     19-20    20-21      21-22     22-23      23-24     24-25
       RESOURCES
       BEGINNING WORKING CAPITAL  $    11,271,259  $    12,521,468  $    13,405,909  $   13,840,305  $   14,766,593  $    16,741,932  $     18,938,275  $    14,046,631
       Revenues:

        Residential Collection           6,421,845         6,550,000           6,350,000         6,475,000         6,650,000          6,700,000           6,750,000         6,800,000
        Commercial Collection            8,606,968         8,550,000           8,325,000         8,350,000         8,570,000          8,580,000           8,590,000         8,600,000
        Industrial Collection               268,071            260,000              250,000            250,000            260,000             260,000              260,000            260,000
        Brush Collection                 2,603,117         2,411,000           2,401,000         2,401,000         2,431,000          2,441,000           2,451,000         2,451,000
        Recycling  Fee                   1,284,394         1,200,000           1,150,000         1,175,000         1,210,000          1,210,000           1,210,000         1,210,000
        Recycling  Sales                    466,285            500,000              300,000            500,000            500,000             500,000              500,000            500,000

        Drop-off Disposal Fee             445   2,000       1,000     2,000     2,000      2,000   2,000     2,000
        Roll-off System                  1,382,850         1,350,000           1,225,000         1,300,000         1,350,000          1,350,000           1,350,000         1,350,000
        Composting                          257,900            300,000              250,000            300,000            300,000             300,000              300,000            300,000
        Brush Disposal                  47,585              30,000     30,000              30,000              30,000               30,000  30,000              30,000


        Garbage Franchise Tax           86,933              60,000     60,000              60,000              60,000               60,000  60,000              60,000
        Fixed assets - Sale of Property    84,386  -       40,000      -          -         -         -         -
        Reimbursements                    -        -        3,000      -          -         -         -         -
        Miscellaneous                   15,813     -       11,000      -          -         -         -         -
        Interest Earned                     295,713   -   94,000            138,403            147,666             167,419              189,383             140,466
       Total Revenues                  21,822,306       21,213,000         20,490,000       20,981,403       21,510,666        21,600,419         21,692,383       21,703,466
       TOTAL RESOURCES           $    33,093,565  $    33,734,468  $    33,895,909  $   34,821,708  $   36,277,259  $    38,342,352  $     40,630,658  $    35,750,097
       APPROPRIATIONS
       Expenses:
         Composting              $         904,445  $        878,516   $         847,355  $        879,141  $        879,141  $         879,141  $          879,141  $        879,141
         Residential                     3,892,746         3,998,841           3,817,964         3,940,932         3,940,932          3,940,932           3,940,932         3,940,932
         Commercial Box                  4,709,338         4,900,428           4,631,898         4,730,550         4,779,207          4,779,207           4,779,207         4,779,207
         Roll-Off                        1,009,649         1,042,725              977,982         1,072,760         1,072,760          1,072,760           1,072,760         1,072,760
         Brush Collection                3,489,148         3,484,317           3,484,566         3,324,881         3,324,881          3,324,881           3,324,881         3,324,881
         Recycling                       1,676,819         1,726,773           1,728,492         1,761,634         1,761,634          1,761,634           1,761,634         1,761,634
         Street Collection                  470,736            530,171              527,961            508,754            508,754             508,754              508,754            508,754
         Administration                  2,697,853         2,469,133           2,280,581         2,456,933         2,534,688          2,534,688           2,534,688         2,534,688
         Liability Insurance                104,034            104,034              104,034            104,034            104,034             104,034              104,034            104,034
         Capital Outlay                     568,032         1,544,500           1,413,437         1,130,450            484,250             353,000           7,532,500            414,000
         Other Agencies                 41,550              41,550     41,550              41,550              41,550               41,550  41,550              41,550

       Total Operating Expenses        19,564,351       20,720,988         19,855,820       19,951,619       19,431,831        19,300,581         26,480,081       19,361,581
       Other Financing Sources (Uses):
        Transfers Out - Health Insurance Fund              455,401            199,784              199,784            103,496            103,496             103,496              103,946            103,496
       TOTAL APPROPRIATIONS            20,019,751       20,920,772         20,055,604       20,055,115       19,535,327        19,404,077         26,584,027       19,465,077
       Other Items Affecting Working Capital            332,094   -   -   -       -         -         -         -
       ENDING WORKING CAPITAL    $    13,405,909  $    12,813,696  $    13,840,305  $   14,766,593  $   16,741,932  $    18,938,275  $     14,046,631  $    16,285,020


                                                          -347-