
Page 16 - text book form physics kssm 2020
P. 16
Scientific Investigation
1.2 Scientific Investigation
We can plot graphs using data from scientifi c investigation and interpret the shapes of the
graphs to determine the relationship between two physical quantities.
Interpretation of Graphs of Different Shapes
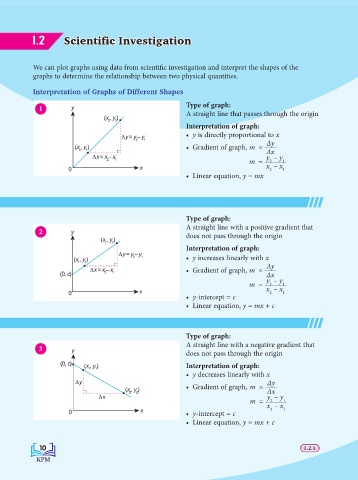
1 y Type of graph:
(x , y ) A straight line that passes through the origin
2 2
Interpretation of graph:
6y = y – y • y is directly proportional to x
2 1
(x , y ) • Gradient of graph, m = Δy
1 1 Δx
6x = x – x y – y
2 1
m = 2 1
0 x x – x 1
2
• Linear equation, y = mx
Type of graph:
A straight line with a positive gradient that
2 y
(x , y ) does not pass through the origin
2 2
Interpretation of graph:
6y = y – y
(x , y ) 2 1 • y increases linearly with x
1 1
6x = x – x • Gradient of graph, m = Δy
(0, c) 2 1 Δx
y – y
m = 2 1
0 x x – x 1
2
• y-intercept = c
• Linear equation, y = mx + c
Type of graph:
A straight line with a negative gradient that
3 y
does not pass through the origin
(0, c) (x , y ) Interpretation of graph:
1 1
• y decreases linearly with x
6y Δy
(x , y ) • Gradient of graph, m = Δx
2
2
6x y – y
m = x – x 1
2
0 x • y-intercept = c 2 1
• Linear equation, y = mx + c
10 10 1.2.1
1.2.1