
Page 19 - text book form physics kssm 2020
P. 19
Bab 1
Chapter 1
Pengukuran
Measurement
Activity 1.3 Abstraction CPS ISS
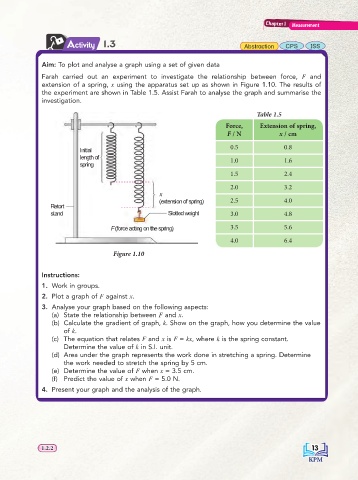
Aim: To plot and analyse a graph using a set of given data
Farah carried out an experiment to investigate the relationship between force, F and
extension of a spring, x using the apparatus set up as shown in Figure 1.10. The results of
the experiment are shown in Table 1.5. Assist Farah to analyse the graph and summarise the
investigation.
Table 1.5
Force, Extension of spring,
F / N x / cm
Initial 0.5 0.8
length of
spring 1.0 1.6
1.5 2.4
2.0 3.2
x
(extension of spring) 2.5 4.0
Retort
stand Slotted weight 3.0 4.8
F (force acting on the spring) 3.5 5.6
4.0 6.4
Figure 1.10
Instructions:
1. Work in groups.
2. Plot a graph of F against x.
3. Analyse your graph based on the following aspects:
(a) State the relationship between F and x.
(b) Calculate the gradient of graph, k. Show on the graph, how you determine the value
of k.
(c) The equation that relates F and x is F = kx, where k is the spring constant.
Determine the value of k in S.I. unit.
(d) Area under the graph represents the work done in stretching a spring. Determine
the work needed to stretch the spring by 5 cm.
(e) Determine the value of F when x = 3.5 cm.
(f) Predict the value of x when F = 5.0 N.
4. Present your graph and the analysis of the graph.
1.2.2 13 13
1.2.2