
Page 17 - text book form physics kssm 2020
P. 17
Bab 1
Chapter 1
Pengukuran
Measurement
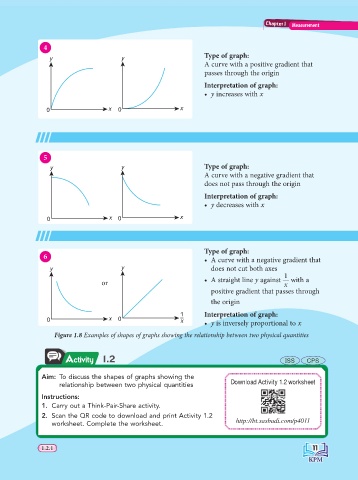
4
y y Type of graph:
A curve with a positive gradient that
passes through the origin
Interpretation of graph:
• y increases with x
0 x 0 x
5
y y Type of graph:
A curve with a negative gradient that
does not pass through the origin
Interpretation of graph:
• y decreases with x
0 x 0 x
Type of graph:
6
• A curve with a negative gradient that
y y does not cut both axes
1
• A straight line y against with a
or x
positive gradient that passes through
the origin
1 Interpretation of graph:
0 x 0 – x • y is inversely proportional to x
Figure 1.8 Examples of shapes of graphs showing the relationship between two physical quantities
Activity 1.2 ISS CPS
Aim: To discuss the shapes of graphs showing the
relationship between two physical quantities Download Activity 1.2 worksheet
Instructions:
1. Carry out a Think-Pair-Share activity.
2. Scan the QR code to download and print Activity 1.2
worksheet. Complete the worksheet. http://bt.sasbadi.com/p4011
1.2.1 11 11
1.2.1